index cloud security
Registry as a Sensor: Wiring Harbor and Trivy into Wazuh, with a Wolfi Agent to Prove It
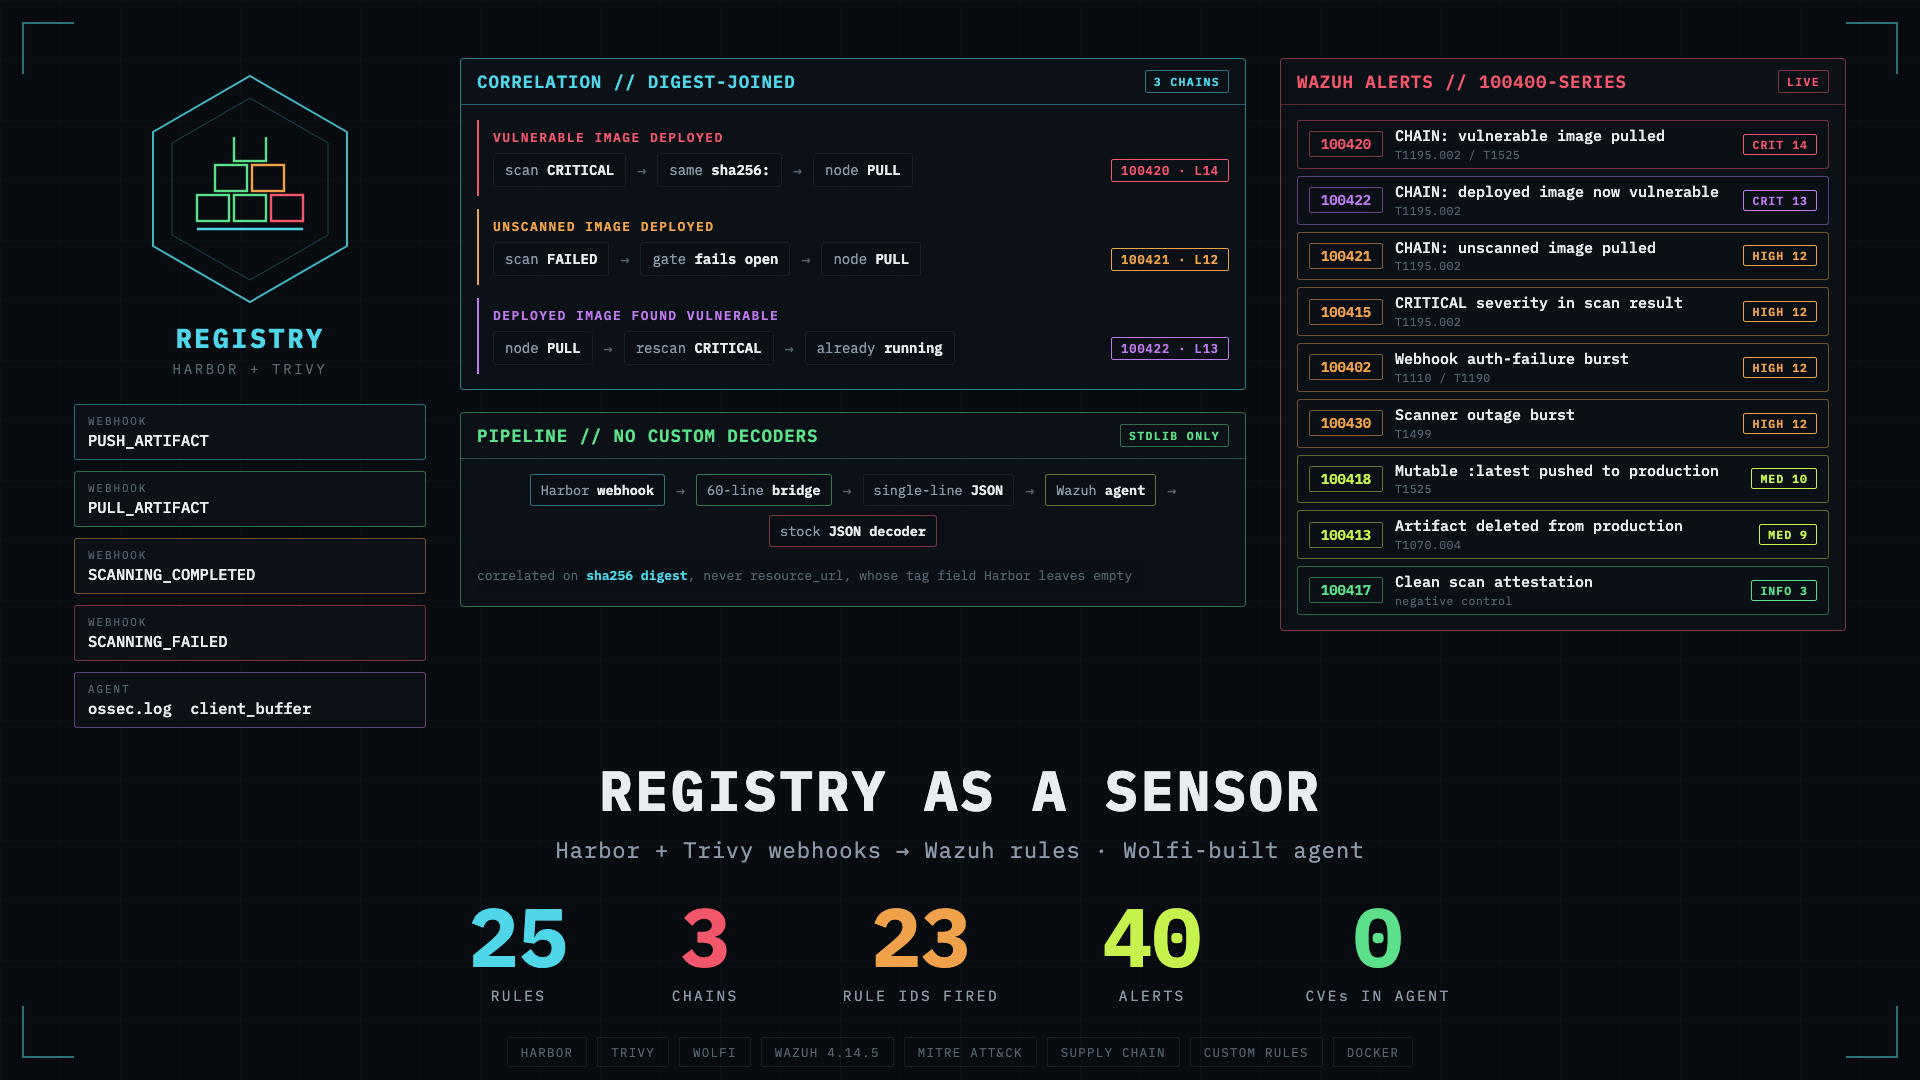
A Harbor→Wazuh webhook bridge, a 25-rule supply-chain detection pack with three correlation chains (vulnerable image deployed, unscanned image deployed, already-deployed image found vulnerable), and a Wazuh agent rebuilt from source on Wolfi that scored 0 CVEs against the official manager image's 567. Validated live on Wazuh 4.14.5: 23 of 25 rules fire from one script, 40 alerts.
The two previous posts in the cloud-native series covered the runtime side of container security with Wazuh: an eBPF sidecar with Tetragon for kernel-level visibility, and a Helm chart that puts the whole stack on Kubernetes with auto-remediation. Both answer the same question: what is this workload doing right now?
Neither answers the question that comes before runtime: what did we just let into the cluster? By the time Tetragon sees a process exec inside a container, the image it came from was built, pushed, scanned (or not), and pulled; every one of those steps emitted a security-relevant event that most SIEM deployments throw away.
Your container registry already knows:
- which images carry critical CVEs, since Harbor runs Trivy on every push if you ask it to;
- which images were never scanned because the scanner errored and the gate failed open;
- which vulnerable image just got pulled by a production node, the exact moment a registry problem became a runtime problem;
- who is POSTing at your infrastructure with the wrong credentials;
- when a production artifact was quietly deleted or replaced
behind a mutable
:latesttag.
Harbor will deliver all of it, in structured JSON, to any HTTP endpoint you configure. Stock Wazuh has nothing listening. The existing Wazuh + Trivy integrations, including the official one, run Trivy on the endpoint via the command wodle, scanning images that are already deployed. That's useful, but it makes every endpoint a scanner. The registry is the natural chokepoint: every image passes through it exactly once, and Harbor already embeds the scanner.
So I built the missing piece. A 60-line stdlib-only webhook bridge, a 25-rule Wazuh pack with three correlation chains, and a one-shot Docker lab that fires 23 of them (40 alerts) from a single script. And because the punchline of a supply-chain post shouldn't be undermined by its own tooling, the repo also ships a Wazuh agent image rebuilt from source on Wolfi, so the agent watching your registry isn't the most vulnerable image in it.
Everything is in a public GitHub repository. No real Harbor required to run the lab; full instructions included for wiring a real one.
The Problem
A container registry sits at the narrowest point of the software supply chain. Everything you deploy passes through it; almost nothing that happens inside it reaches your SIEM.
Concretely, on a Harbor + Trivy setup that most platform teams would recognize:
- Scan results die in the UI. Trivy flags an image Critical; Harbor renders a red badge. Nobody is looking at the UI at 2 a.m. when CI pushes the image, and no correlation engine ever sees the event.
- Scan gates fail open. When the Trivy adapter errors (registry under load, DB update mid-flight, adapter OOM), the image sits in the registry unscanned. Deployment tooling pulls it anyway. There is no alert for "this image was never vetted": absence of data looks identical to a clean bill.
- The pull is the moment that matters. "Image X has 3 critical CVEs" is registry hygiene. "Image X has 3 critical CVEs and a production node just pulled it" is an incident. Joining those two events needs a correlation engine with state, exactly what a SIEM is and a registry isn't.
- The registry is itself an attack surface. Webhook endpoints get probed, artifacts get deleted to cover image swaps, mutable tags make production non-reproducible, quota exhaustion is a denial-of-service on your deploy pipeline.
Wazuh can express all of these detections: it has JSON ingestion,
cross-event correlation with <same_field> joins, and severity
tiering. What's missing is plumbing: Harbor speaks webhooks, Wazuh
has no native webhook receiver.
This post supplies the plumbing and the rules.
Architecture: One Compose, Two Containers, Zero Custom Decoders
Why webhooks and not the registry's logs
The instinctive Wazuh approach to a new data source is to point an agent at its log files. That is the wrong choice here, for four reasons worth stating before any code:
- The scan verdict isn't in the logs. Harbor's core and jobservice logs record that a scan job ran; the vulnerability report (severity, CVE counts, fixable count) lives in Harbor's database and is surfaced through the API and the webhook payload. Tail the logs and you learn a scan happened, not what it found, which is the one thing the detections need.
- Log access often doesn't exist. Harbor is increasingly consumed as a managed service or as a Helm release someone else operates. Webhooks are configuration; log file access is infrastructure ownership. The webhook design works against a registry you don't have a shell on.
- Push beats poll for a correlation engine. The chain rules care about the order and spacing of scan and pull events. A webhook arrives within a second of the event; the API alternative is polling, which smears timestamps and would need its own state to avoid re-reading the same artifacts.
- Signal-to-noise. A registry's access log is dominated by blob GETs: every layer of every pull. The webhook stream is one event per meaningful action, which is why this integration needs no custom decoders and no filtering tier.
The cost of the choice is that it introduces a component: something has to receive the HTTP POST. That component is the bridge below, and it's deliberately small enough to audit in one sitting.
   Harbor (real, optional)          triggers/ (payload replay)
          │                                │
          └────────── POST /webhook ───────┘
                         │  Authorization: <token>
                         ▼
          ┌─────────────────────────────────────┐
          │  wazreg-receiver                    │
          │  · harbor_receiver.py (stdlib HTTP) │
          │    - auth check before body read    │
          │    - normalizes 3 payload shapes    │
          │    - 1 compact JSON line/artifact   │
          │    - logs its own probes too        │
          │  · Wazuh agent                      │
          │    <log_format>json</log_format>    │
          │    + its own ossec.log (100405/407) │
          └────────────────┬────────────────────┘
                           │ 1514/tcp (events)
                           ▼
          ┌─────────────────────────────────────┐
          │  wazreg-manager                     │
          │  wazuh/wazuh-manager                │
          │  rules 100400–100430                │
          └─────────────────────────────────────┘
The previous post in this series spent its plumbing budget on custom decoders: PCRE2 shaping of dnsmasq lines, syslog framing traps, a Python sidecar to inject missing hostnames. This lab needs none of that, and the reason is a design decision worth stating as a rule:
If you control the log producer, emit single-line JSON under a private namespace and let Wazuh's stock JSON decoder do the work.
The bridge (receiver/harbor_receiver.py, ~150 lines, Python stdlib
only: no Flask, no pip, nothing to patch later) takes Harbor's nested
notification and emits one compact line per artifact:
{"harbor":{"auth_ok":"yes","cve_critical":3,"cve_fixable":29,"cve_high":11,"cve_low":40,"cve_medium":24,"cve_total":78,"digest":"sha256:2c3d0000…","event_type":"SCANNING_COMPLETED","occur_at":1785315377,"operator":"auto","project":"prod","repo":"prod/payments-api","resource_url":"harbor.lab/prod/payments-api@sha256:2c3d0000…","scan_status":"Success","severity":"Critical","src_ip":"127.0.0.1","tag":""}}
Note the empty tag and the @sha256: in resource_url. That is
Harbor's real scan-event shape, and getting it wrong is the single
biggest mistake in the first version of this pack.
The agent ingests the file with <log_format>json</log_format>, and
every rule matches on decoded harbor.* fields directly. Four
receiver details that carry real weight:
-
Failed auth is an event, not a drop. A POST with a wrong
Authorizationheader gets logged asevent_type: AUTH_FAILUREwith the source IP, so the webhook receiver doubles as a probe detector for itself (rules 100401/100402). Infrastructure that can detect attacks on itself is the difference between a bridge and a sensor. -
Every value is coerced to a scalar, and JSON
nullbecomes an empty string. Both matter more than they sound. A nested object intypedecodes asharbor.event_type.<sub>, which matches no rule at all (not even the anchor), making the event invisible to the SIEM. Andres.get("tag", "")returnsNonewhen the key is present with a null value, which then sails past a^(latest)?$field regex. The red team found both. - The
scan_overviewkey is never matched. Harbor keys the scan report by MIME type, and that MIME type changed between Harbor versions (application/vnd.security.vulnerability.report; version=1.1today, aharbor+json; version=1.0variant before). The bridge iterates the dict's values and ignores the key, so both generations parse. - One
write()per event, compact separators. The stock JSON decoder rejects multi-line or concatenated objects silently: the events just never appear. If you take one implementation detail from this post: a JSON log line must be exactly one line, and interleaved writes from concurrent requests will eventually corrupt one. The bridge serializes writes.
The lab replays byte-accurate Harbor 2.x payload shapes from
trigger scripts, so docker compose up needs no Harbor at all. The
repo's harbor/README.md walks through wiring a real Harbor
(./install.sh --with-trivy, scan-on-push, per-project webhook
policies with an auth header, plus an API loop to create policies
across projects). The receiver can serve both at once.
The 25 Rules
All rules live in 100400–100440, clear of stock Wazuh, clear of the
shadow-AI packs (100200s, 100300s). Severity follows the same
philosophy as the previous packs: cheap high-volume telemetry stays
at inventory level; paging severity is reserved for content matches,
correlation joins, and abuse of the pipeline itself.
The pack divides into six functional groups. If you read nothing else in this section, read this table, which is the whole design in one screen:
| Group | IDs | What it answers | Loudest rule |
|---|---|---|---|
| Anchor | 100400 |
"Did anything happen at all?" Catches every event, including types Harbor adds in future versions | level 3 |
| Webhook pipeline abuse | 100401–100404, 100406 |
"Is someone attacking the sensor itself?" Bad tokens, malformed bodies, probes | level 12 |
| Pipeline health | 100405, 100407 |
"Are my detections still working?" The agent filling up, then dropping events | level 12 |
| Artifact lifecycle | 100410–100413, 100418 |
"What entered, left or vanished from the registry?" Pushes, pulls, deletions, mutable tags | level 10 |
| Scan results | 100414–100417, 100419 |
"What did Trivy actually find, and did it find anything at all?" | level 12 |
| Correlation chains | 100420–100422 |
"Did a known-bad image reach a runtime?" The reason the pack exists | level 14 |
| Registry operations | 100425–100427, 100430 |
"Is the registry itself healthy?" Quota, replication, retention, scanner outage | level 12 |
Two of those groups are unusual and worth flagging early. Pipeline health watches the SIEM rather than the registry, and scan results treats a missing answer as a finding rather than a non-event. Both exist because of things the adversarial review pass broke, described later.
The walkthrough below takes each group in turn.
Anchor (100400)
Every bridge event anchors at level 3. Unknown event types, which
Harbor adds between versions (TAG_RETENTION fires in the lab
deliberately), still land here, so the pack is forward-compatible by
construction: new Harbor event types surface as anchor alerts instead
of vanishing.
Webhook pipeline abuse (100401–100404, 100406)
Purpose: detect attacks on the sensor itself. A webhook receiver is an HTTP endpoint holding a shared secret; if it can be probed silently, it is a liability rather than a sensor.
<rule id="100401" level="9">
  <if_sid>100400</if_sid>
  <field name="harbor.event_type" type="pcre2">^AUTH_FAILURE$</field>
  <description>Harbor webhook receiver: unauthorized POST from $(harbor.src_ip) (bad/missing auth header)</description>
  <mitre><id>T1190</id></mitre>
  <group>webhook_abuse,attack,</group>
</rule>
100402 escalates to level 12 on ≥5 bad-auth POSTs in 60 seconds: token guessing against your event pipeline. 100403 catches authenticated-but-malformed payloads (a real Harbor never sends non-JSON; a spoofed sender might), 100404 catches oversized bodies rejected before they are read, and 100406 catches the unauthenticated GET that usually precedes someone trying the token at all.
Two composite-rule traps the lab caught live. First, the initial
100402 was the "obvious" shape: <if_matched_sid>100401 plus
frequency and timeframe, nothing else. It never fired. Six
bad-auth POSTs in six seconds, six 100401 alerts, no burst alert. A
frequency rule needs the current event anchored with its own
<if_sid> + field match alongside the <if_matched_sid> history
reference, the same shape as the chain rules below.
Second, and more subtly: I later added ignore="60" to 100401 to keep
a probing loop from flooding the console. That silently disabled
100402: ignore suppresses the rule for the whole window, so the
burst rule never accumulated its five matches, and the suppressed
events fell back to the level-3 anchor with an empty description.
ignore belongs on the escalation, never on the building block it
counts.
Artifact lifecycle (100410–100413, 100418)
Purpose: maintain an inventory of what enters and leaves the registry, and flag the two lifecycle events that carry security weight on their own: deletion from production, and a mutable tag pointing at production.
Pushes are inventory (level 5), pushes to a production-tier project are higher inventory (level 7), pulls are level 4 join anchors that never page alone. Two are worth showing:
<!-- deletion from production: legitimate during cleanup; also exactly
     what covering tracks after an image swap looks like -->
<rule id="100413" level="9">
  <if_sid>100400</if_sid>
  <field name="harbor.event_type" type="pcre2">^DELETE_ARTIFACT$</field>
  <field name="harbor.project" type="pcre2">(?i)^(prod|production|release|platform)([-_/].*)?$</field>
  <description>Image DELETED from production project: $(harbor.repo) by $(harbor.operator)</description>
  <mitre><id>T1070.004</id></mitre>
</rule>

<!-- mutable tag in production: tomorrow's pull is not today's image -->
<rule id="100418" level="10">
  <if_sid>100411</if_sid>
  <field name="harbor.tag" type="pcre2">(?i)^(latest|main|master|dev|develop|stable|edge|nightly|snapshot|current|rolling|prod|production|release|staging|test|qa|latest-[a-z0-9]+|v?\d+(\.\d+)?)$</field>
  <description>Mutable tag pushed to production project: $(harbor.repo):$(harbor.tag) — image identity not pinned</description>
  <mitre><id>T1525</id></mitre>
</rule>
Both regexes started narrower and got widened by the red team, which
pushed to prod-eu and Production and tagged main, stable and
LATEST, all of which are exactly as mutable as latest, and all of
which the first version waved through. The project pattern is still
the one knob every deployment must turn: a project named
prod2 or platform-core-eu that doesn't match loses three rules
silently, with no error anywhere.
One semantic correction worth stating, because the obvious version is
backwards: the original regex was ^(latest)?$, which also matches
the empty tag. But an empty tag in Harbor means the artifact was
pushed by digest, the most strongly pinned form there is. The rule
was flagging the single most immutable case as "not pinned."
Scan results (100414–100417, 100419)
Purpose: turn Trivy's verdict into an alert and, just as importantly, turn the absence of a verdict into one. Half of this group exists to make "nobody scanned this" as visible as "this is vulnerable."
100415 (level 12) fires on SCANNING_COMPLETED with Critical
severity:
<rule id="100415" level="12">
  <if_sid>100400</if_sid>
  <field name="harbor.event_type" type="pcre2">^SCANNING_COMPLETED$</field>
  <field name="harbor.severity" type="pcre2">(?i)^critical$</field>
  <description>CRITICAL vulnerabilities in registry image $(harbor.repo): $(harbor.cve_critical) critical / $(harbor.cve_high) high ($(harbor.cve_fixable) fixable)</description>
  <mitre><id>T1195.002</id></mitre>
</rule>
That match started life as ^[1-9][0-9]*$ on harbor.cve_critical, a
cute way to express "greater than zero" against a decoded JSON number.
The red team killed it: send a report whose severity is Critical
but whose summary lacks a Critical key (or is null, or uses
lowercase keys), and the event fell through 100415, 100416 and
100417 to the level-3 anchor. Matching the count made the rule go
quiet exactly when the payload was malformed, the worst possible
failure direction. Harbor's severity is the scanner's own verdict
and is present whenever a report is, so the rule matches that instead
and keeps the counts in the description.
100414 (level 7) is the rule I'd argue matters more than the critical
one: SCANNING_FAILED / SCANNING_STOPPED. A failed scan is not
a vulnerability; it's a blind spot, and blind spots are how vulnerable
images get past "scan gates" that fail open.
100419 is the same idea for a nastier case the blue team found:
Harbor emits SCANNING_COMPLETED with scan_status: "Error" and
severity: "Unknown" when the Trivy adapter returns nothing usable.
The original 100417 allow-list included Unknown, so that event was
filed as a clean-scan attestation: an image nothing ever scanned
getting a green tick on the compliance dashboard. 100417 now requires
scan_status Success and a real severity; everything else routes to
100419 and the blind_spot group.
The chains (100420, 100421, 100422): the headline
Purpose: join two innocuous events into one incident. A scan verdict is registry hygiene and a pull is routine traffic; the pair, on the same artifact, is the moment a registry problem became a runtime problem.
<rule id="100420" level="14" frequency="2" timeframe="3600">
  <if_matched_group>critical_cve</if_matched_group>
  <if_sid>100412</if_sid>
  <same_field>harbor.digest</same_field>
  <field name="harbor.digest" type="pcre2">^sha256:[0-9a-f]{16,}$</field>
  <field name="harbor.operator" negate="yes" type="pcre2">^robot\$</field>
  <description>VULNERABLE IMAGE DEPLOYED: $(harbor.repo) ($(harbor.digest)) pulled by $(harbor.operator) after scan reported critical CVEs</description>
  <mitre><id>T1195.002</id><id>T1525</id></mitre>
</rule>
A Trivy scan reported critical CVEs; within the hour, the same digest was pulled by something that isn't the scanner. Each event alone is registry noise. The join is the exact moment a registry problem became a runtime problem.
Every line after <if_sid> in that rule is there because something
broke without it, and the next section tells that story. The short
version:
<same_field>harbor.digest</same_field>, notresource_url, which takes different forms in scan and pull events and therefore never joins;- the digest format guard:
same_fieldconsiders two empty strings equal, so digest-less events (quota, replication) would otherwise forge a level-14 alert; - the
robot$exclusion: Harbor's own scanner pulls every image it scans; <if_matched_group>critical_cve</if_matched_group>instead of<if_matched_sid>100415</if_matched_sid>, because when the reverse-order chain fires on a scan, that scan never records a 100415, and a sid-based history would lose the image entirely.
100421 is the same join over the blind_spot group instead:
something deployed an image that nothing ever vetted: the fail-open gate, at level 12.
100422 is the one I expect to fire most in the real world, and it
exists only because the red team pointed out that my event ordering
was wrong. Harbor scans on push, but a CD pipeline or a restarting pod
pulls within seconds, so the Critical verdict usually lands after
the deployment. <if_matched_sid>/<if_matched_group> are strictly
ordered, so 100420 structurally cannot see that case. 100422 is the
same correlation with the operands swapped: pull first, scan second,
level 13, "you are running this right now" rather than "this is being
deployed."
A correlation rule that can't survive a negative control isn't a detection, it's a coincidence generator. So the lab fires three inside the correlation window that all must not chain: a clean image pulled, Harbor's scanner re-pulling the bad image, and two digest-less quota events.
Registry operations (100425, 100426, 100427, 100430)
Purpose: watch the registry's own health. Most of this group is inventory, but the scanner-outage rule belongs here rather than with the scan results, because it describes a broken service, not a vulnerable image.
Quota events at level 6 (carrying Harbor's own Details string),
replication and tag retention at level 5 (both of which arrive in
payload shapes that share nothing with the artifact events, and are
normalized by the bridge), and the third frequency rule at level 12:
≥3 unusable scans in 10 minutes is not three image problems, it's a
scanner outage, and every image pushed while it lasts enters the
registry unvetted.
100430 has one non-obvious property. It fires on the same blind_spot
group it belongs to, and it supersedes the per-image 100414 alerts
it counts, which, in the first version, quietly removed those images
from the correlation history and blinded 100421 during exactly the
outage it was reporting. That's why 100421 matches the group rather
than rule 100414 specifically, and why 100430 names the latest image
in its description: without that, the record of which images went
unvetted during the outage is lost entirely.
Pipeline health: the rules that watch the SIEM, not the registry (100405, 100407)
Purpose: detect that detection has stopped. Every other rule in this pack assumes events are arriving; these two are what tell you when that assumption is false.
This pair is not a registry detection. It is a detection that the detections have stopped, and getting it right took three attempts, each of which is worth more than the rule itself.
The Wazuh agent's client_buffer throttles events and drops
everything above events_per_second: drops, not delays. Nothing
downstream can detect an event that was never delivered, so the pack
watches the symptom instead: the agent ingests its own ossec.log,
and the warnings it writes about its own health become alerts.
Attempt one matched the wrong string. The obvious warning to match, and the one a flood surfaces first, is:
wazuh-logcollector: WARNING: Target 'agent' message queue is full (1024). Log lines may be lost.
That is a different bottleneck: the collector-to-agentd socket, not
the client buffer. When the client buffer itself overflows,
wazuh-agentd writes something else entirely:
wazuh-agentd: WARNING: Agent buffer at 90 %.
wazuh-agentd: WARNING: Agent buffer is full: Events may be lost.
wazuh-agentd: WARNING: Agent buffer is flooded: Producing too many events.
A rule matching only the first string sits silent through the exact scenario it was written for. The shipped rule matches all of them:
<rule id="100405" level="12">
  <location>/var/ossec/logs/ossec.log</location>
  <regex type="pcre2">Agent buffer is full|Agent buffer is flooded|message queue is full|Log lines may be lost|Events may be lost</regex>
  <description>Wazuh agent is DROPPING events — registry detections are blind</description>
  <mitre><id>T1562.006</id></mitre>
  <group>pipeline_health,blind_spot,</group>
</rule>
Attempt two was correct and still didn't fire. With the regex
fixed, I wrote 860,000 events into the bridge's log and watched.
The agent logged all three warnings on schedule. alerts.json
recorded none of them.
The reason is the most interesting thing in this post. At the moment
wazuh-agentd writes "Agent buffer is full: Events may be lost", it
is discarding events, and the log line announcing that fact is itself
an event, queued behind the flood, and discarded with everything else.
The blindness detector gets blinded by the precise condition it
exists to detect. Feeding the same line to a drained agent fires
100405 at level 12 immediately, so the rule is correct; it simply
cannot be relied upon at the one moment it matters.
Attempt three is the one that works. The agent warns at 90% occupancy before it begins discarding, and at 90% there is still room in the buffer to ship the warning:
<rule id="100407" level="7">
  <location>/var/ossec/logs/ossec.log</location>
  <regex type="pcre2">Agent buffer at \d+ ?%</regex>
  <description>Wazuh agent buffer filling up — event loss is imminent</description>
  <group>pipeline_health,</group>
</rule>
In the flood test, 100407 fired and 100405 did not. Of the 860,000 events written, 241,669 became alerts: roughly 72% were silently discarded, and the only alert that survived to say so was the early-warning one.
So the operational guidance is the inverse of the intuition: the level-12 "events are being dropped" rule is the backstop, useful for brief bursts and for post-hoc forensics once the buffer drains. The level-7 "buffer at 90%" rule is the one that actually reaches you during an incident. Alert on the quieter rule.
Of all the rules here, these two are the ones I would least want to remove, and the only ones a healthy lab run does not fire.
Live Validation: 23 of 25 Rules, 40 Alerts
One 00-fire-all.sh produces 40 alerts across 23 rule IDs, the
same on the bundled Wazuh 4.10 lab and on a full 4.14.5 stack
with indexer and dashboard, which is worth stating because the
previous post in this series was bitten by a behavioural change
between minor versions.
Why 23 and not 25. The two rules that stay silent are the
pipeline-health pair, 100405 and 100407, and their silence is the
correct result rather than a gap in the lab. Neither matches a Harbor
event at all: they match warnings in the Wazuh agent's own log that
appear only when the agent's client_buffer is filling or discarding.
The trigger scripts fire 40 events over about ninety seconds, roughly
four orders of magnitude below the 1000 events/second threshold, so a
healthy run must not produce them. A lab where all 25 fired would
mean the test harness was overwhelming the agent, which is the
condition those rules exist to report.
They were verified separately, by creating the condition on purpose:
860,000 events written into the bridge's log in bulk. That test is
where the pipeline-health section's finding came from: 100407 fired,
100405 did not, and about 72% of the events were discarded without a
trace. Worth reading if you skipped it, because the first version of
100405 matched a string the agent never writes in that scenario, and
the lab was green throughout.
That distinction, rules that are quiet because nothing happened versus rules that are quiet because they are broken, is the same one the red-team pass turned up in a far more damaging form, and it is the reason the pack ships negative controls rather than only positive ones.
The 23 that do fire:
| Rule | Lvl | Fires | Trigger | What |
|---|---|---|---|---|
| 100400 | 3 | 1 | 05 | Anchor: CHART_UPLOAD (no specific rule, still visible) |
| 100401 | 9 | 7 | 06 | Unauthorized webhook POST |
| 100402 | 12 | 1 | 06 | Auth-failure burst (8 sent; the 8th escalates) |
| 100403 | 7 | 1 | 06 | Malformed payload / malformed Content-Length |
| 100404 | 9 | 1 | 06 | Oversized body, rejected before it was read |
| 100406 | 5 | 1 | 06 | Unauthenticated GET probe |
| 100410 | 5 | 1 | 01 | Push to dev (non-production inventory) |
| 100411 | 7 | 4 | 01/02/05/07 | Push to production project |
| 100412 | 4 | 4 | 01/03/04/07 | Pulls (clean + robot; the vulnerable ones supersede into chains) |
| 100413 | 9 | 1 | 05 | Artifact deleted from production |
| 100414 | 7 | 3 | 04 | Failed Trivy scan (5 sent; 2 supersede into 100430) |
| 100415 | 12 | 2 | 02/03 | Critical severity in scan result |
| 100416 | 10 | 1 | 02 | High severity |
| 100417 | 3 | 1 | 01 | Clean scan attestation |
| 100418 | 10 | 1 | 05 | Mutable :latest pushed to production |
| 100419 | 7 | 1 | 04 | Scan "completed" with an unusable result |
| 100420 | 14 | 1 | 03 | CHAIN: vulnerable image pulled |
| 100421 | 12 | 1 | 04 | CHAIN: unscanned image pulled |
| 100422 | 13 | 1 | 07 | CHAIN: already-deployed image found vulnerable |
| 100425 | 6 | 3 | 05/07 | Quota events |
| 100426 | 5 | 1 | 05 | Replication run |
| 100427 | 5 | 1 | 05 | Tag retention run |
| 100430 | 12 | 1 | 04 | Scanner outage burst |
The supersession arithmetic is worth reading once: when 100420 fires on a pull, that pull does not also log as 100412: Wazuh publishes only the highest-severity matching rule per event. That's why the lab pulls a clean image too (a surviving 100412 proves pulls are being tracked), and why the burst rules "eat" some of their building-block alerts. If your counts ever look short while chains are firing, this is where the missing events went.
Live on the Wazuh dashboard
Reproduced end-to-end on Wazuh 4.14.5. Filtering Threat Hunting to
rule.groups:harbor shows the whole pack: 40 alerts, 7 at level 12
or above, and a MITRE spread that reads like a supply-chain attack
narrative rather than a vulnerability list: Compromise Software Supply
Chain (T1195.002), Implant Internal Image (T1525), Exploit
Public-Facing Application (T1190), Active Scanning (T1595), Brute
Force (T1110), Endpoint Denial of Service (T1499) and File Deletion
(T1070.004):
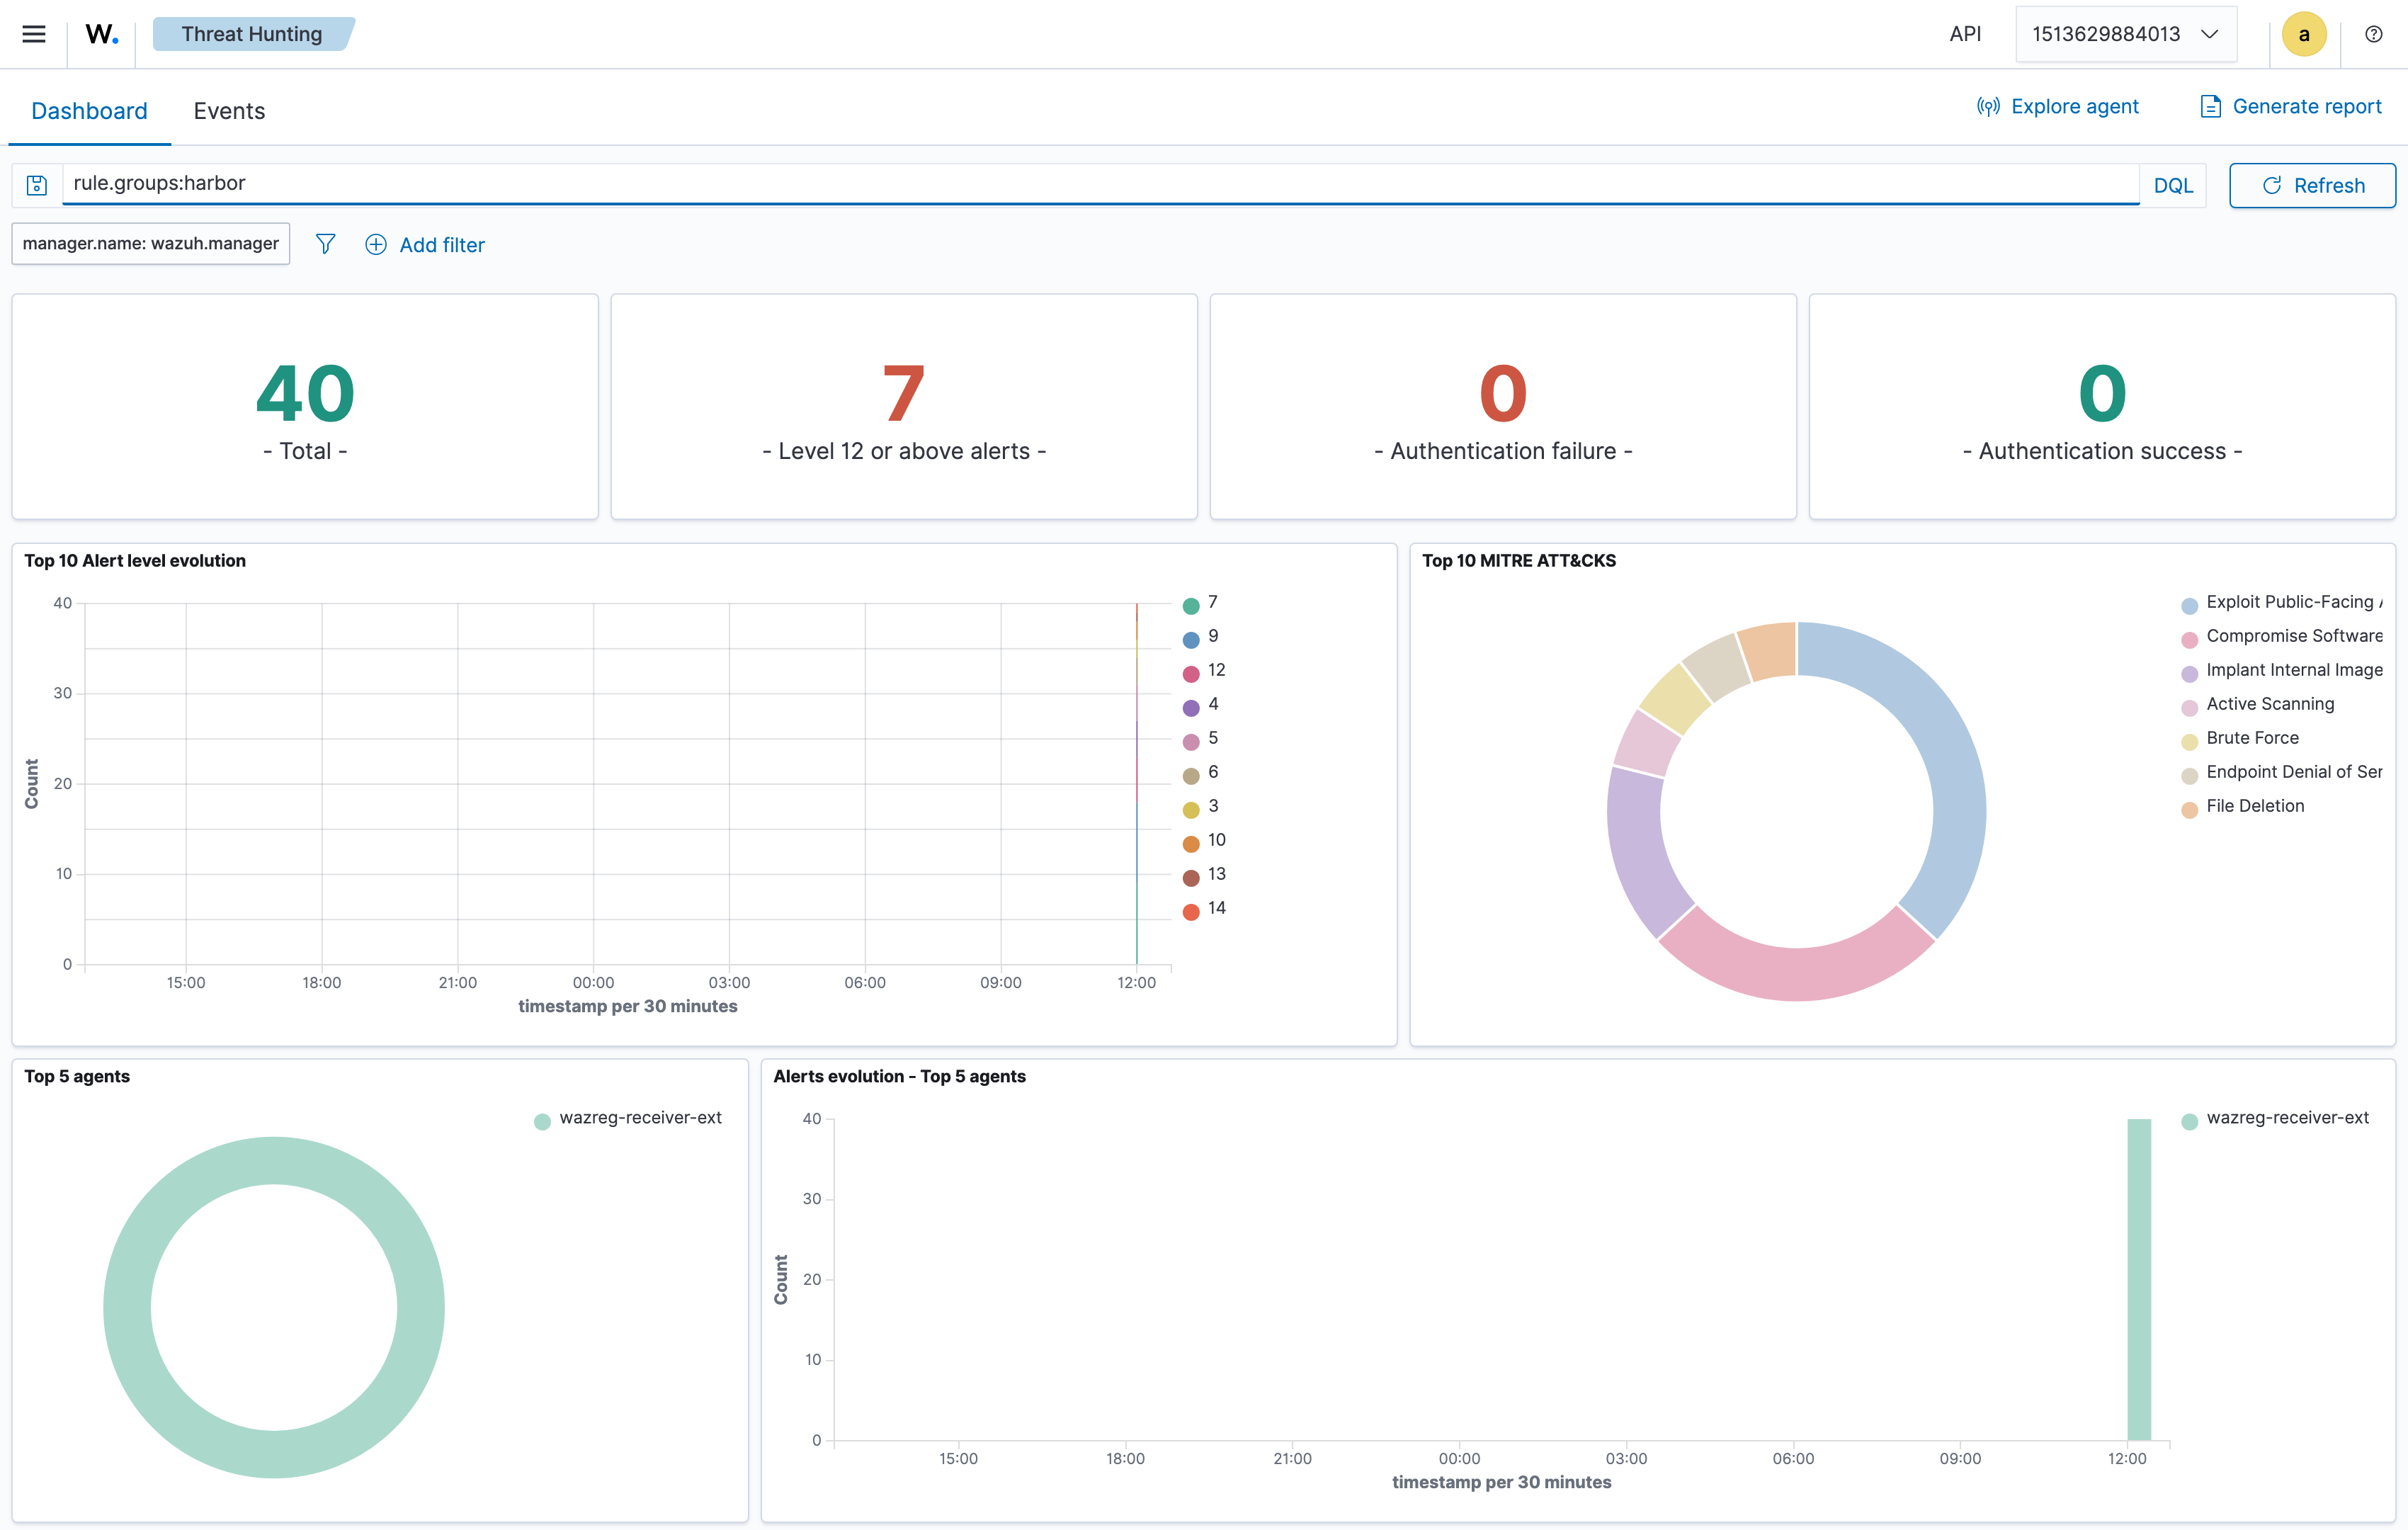
What to look at here. Three things. The Total of 40 matches the alert table above exactly; that is the same run, not a busier one. The 7 at level 12 or above is the number that matters operationally: those are the only alerts that would page anyone, out of 40 events, which is the severity tiering working as designed. And the MITRE ring is the argument for the whole pack in one widget: Compromise Software Supply Chain and Implant Internal Image are the two largest slices, meaning the registry's telemetry is being classified as supply-chain attack technique rather than as vulnerability-management noise.
Dropping the inventory tiers (rule.groups:harbor and rule.level>=9)
surfaces the substantive detections, and all three correlation chains
are visible in one screen: the vulnerable image deployed (100420, level
14), the never-scanned image deployed (100421), the already-deployed
image that came back critical (100422), plus the scanner outage, the
mutable production tag, the production deletion, and the webhook
probing:
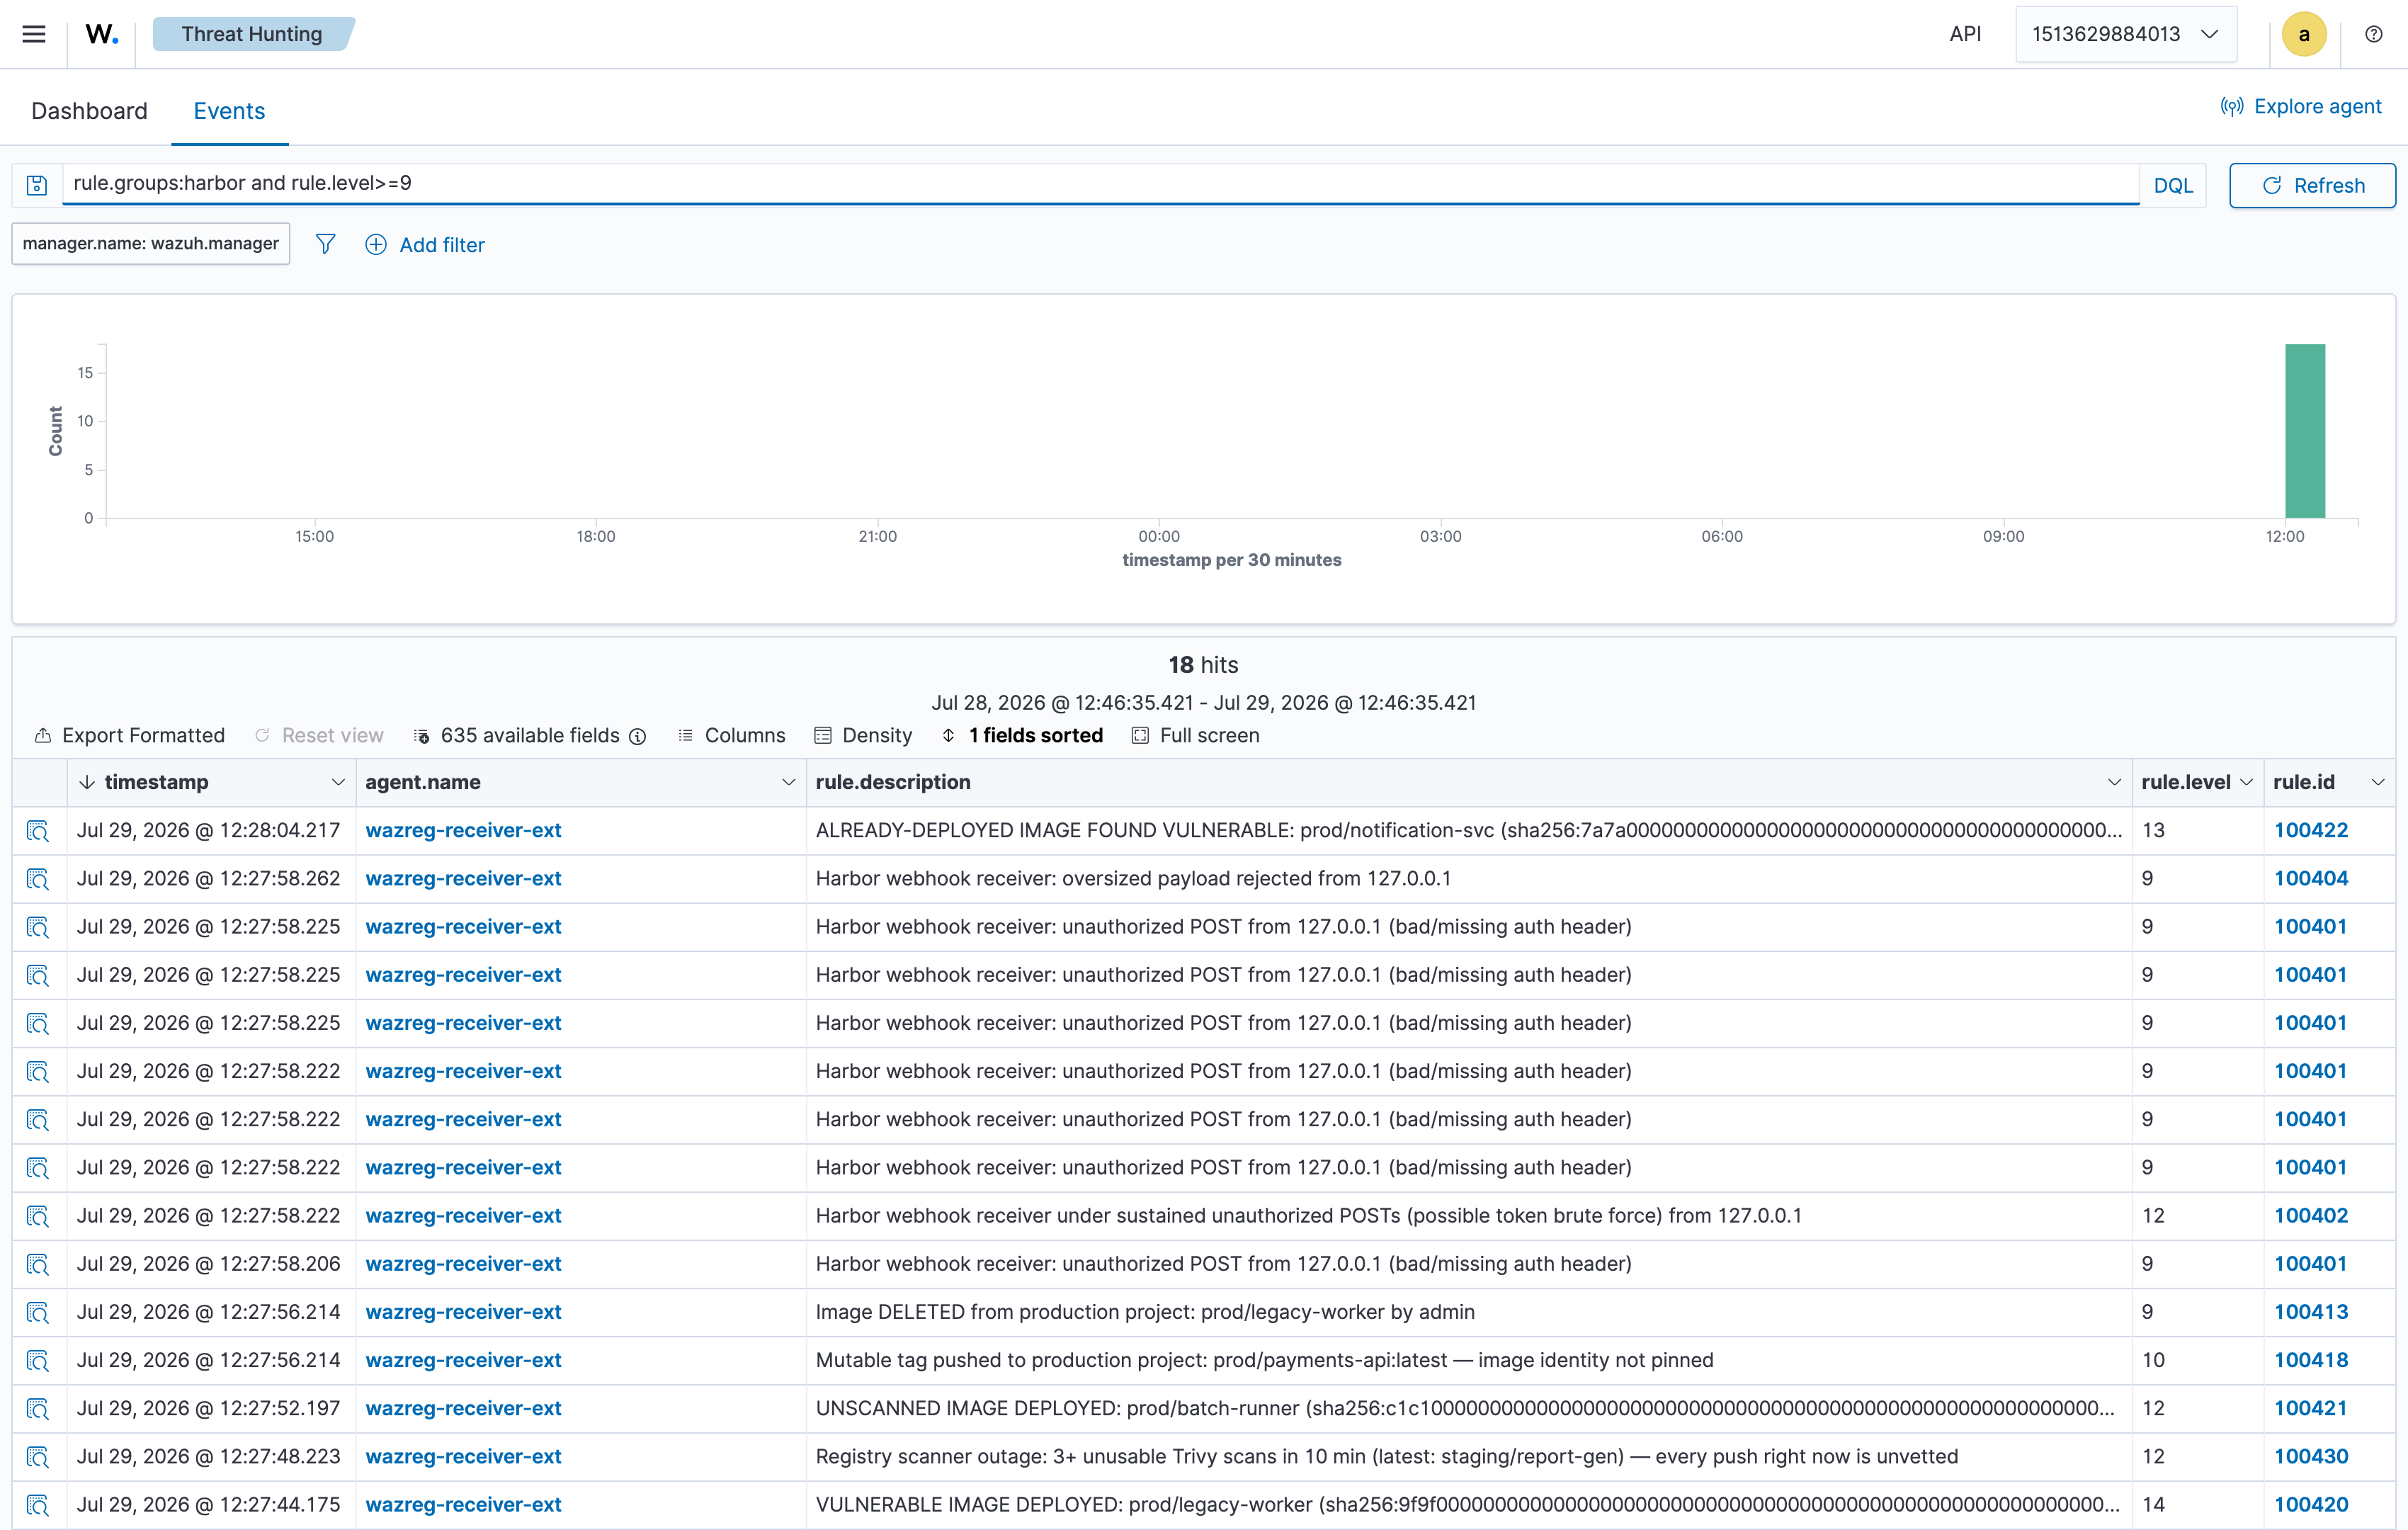
What to look at here. Read the rule.id column from the bottom
up, because that is the incident in chronological order:
100420, level 14, the VULNERABLE IMAGE DEPLOYED: prod/legacy-worker alert. This is the headline chain firing: a Critical scan verdict and a pull of the same digest, joined.100430, level 12, the scanner outage, naming the last image it saw, so the unvetted window has a record.100421, level 12, the UNSCANNED IMAGE DEPLOYED: prod/batch-runner alert, firing during that outage. That is the fix for the superseding bug described below: the earlier version of this rule went silent exactly here.100418and100413: the mutable production tag and the production deletion, the two lifecycle events that stand alone.100422, level 13 at the top: the reverse-order chain, where the pull came first and the Critical verdict arrived afterwards.
The single most important thing in this screenshot is what isn't
in it: there is no 100420 for the clean image pulled inside the same
correlation window, and none for Harbor's scanner re-pulling the bad
image. Both were fired deliberately by trigger 03. A correlation
rule is only as good as the events it declines to join.
The representative headline alert:
{
  "rule": {
    "level": 14,
    "description": "VULNERABLE IMAGE DEPLOYED: prod/legacy-worker (sha256:9f9f…) pulled by k8s-prod-node after scan reported critical CVEs",
    "id": "100420",
    "frequency": 2,
    "mitre": { "id": ["T1195.002", "T1525"] }
  },
  "agent": { "id": "001", "name": "wazreg-receiver-ext" },
  "decoder": { "name": "json" },
  "data": { "harbor": { "event_type": "PULL_ARTIFACT",
                        "digest": "sha256:9f9f…",
                        "operator": "k8s-prod-node" } }
}
Red-Team and Blue-Team Pass: How the Headline Rule Was Broken
As with the previous two posts, I ran a red-team agent and a blue-team agent against the lab before publishing. This time they found something that changes the whole design, so it's worth showing the failure mode rather than just the fix.
The first version of this pack could not have worked in
production. Both chain rules joined on
<same_field>harbor.resource_url</same_field>, which reads as
obviously correct: same image, same URL, join them. Then the blue team
checked the shape against Harbor's actual documented
payloads:
SCANNING_COMPLETEDreports a digest-formresource_url(registry/project/repo@sha256:…) and, in Harbor's own example, carries notagkey at all;- a tagged
PULL_ARTIFACTreports tag-form; - and the tag field has been empty or inconsistent across versions (#13464, #14293).
Two forms, never string-equal, so the join never fires. Verified directly: a real-shape critical scan followed by a normal tag pull of the same artifact produced a level-4 "image pulled" alert and nothing else. The exact scenario the project advertises produced no alert. It passed my lab only because my triggers fabricated both sides in the same shape: the test data was wrong in precisely the way the rule was wrong, which is the most comfortable way to be wrong and the least useful.
The fix is one line (join on harbor.digest, which is present and
identical in every event type), but it took an adversarial reader to
find, because the lab was green the entire time.
The red team then broke the fixed version four more ways:
same_fieldtreats two empty strings as equal. Quota, replication and retention events carry no digest, so two of them could satisfy the join and forge a level-14 alert. Fixed with a format guard:^sha256:[0-9a-f]{16,}$.- Harbor's scanner pulls every image it scans, as a robot account.
So a re-scan of a known-critical image was indistinguishable from a
deployment: the rule was silent on real deployments and paged on the
scanner's own traffic. Fixed by excluding
^robot\$operators. - The event order is usually the opposite of what the rule
assumed. Harbor scans on push, but a CD pipeline or a restarting
pod pulls within seconds, so the Critical verdict typically arrives
after the deployment.
<if_matched_sid>is strictly ordered, so the forward chain structurally cannot see that case. It needed its own rule with the operands swapped (100422), which is now the one I expect to fire most often in the real world. - An event flood silently deletes alerts. The agent's
client_bufferdrops everything aboveevents_per_second; 4000 harmless pull events at ~1700/s buried a Critical scan alert completely: it reached the bridge's log and never became an alert. Anyone holding the webhook token can do this. There is no rule that can detect a dropped event, so the fix is to alert on the symptom: rule 100405 fires on the agent's own "message queue is full" warning. It is the only rule here that watches the pipeline instead of the payload, and it is the one I would least want to live without.
The blue team's contributions were quieter but equally load-bearing: a
scan that "completed" with scan_status: Error was being filed as a
clean-scan attestation (an unscanned image getting a green tick on
the compliance dashboard), the scanner-outage rule was superseding the
per-image blind-spot alerts and thereby blinding the very chain meant
to catch deployments during an outage, and a null tag sailed past a
^(latest)?$ regex because res.get("tag", "") returns None when
the key exists with a JSON null.
Two more traps surfaced only because the fixes were re-validated end-to-end rather than reasoned about:
ignoreon a rule kills the frequency rule built on top of it. Addingignore="60"to the auth-failure rule (a sensible-looking noise control) meant the burst rule never accumulated its five matches, and the suppressed events fell back to the level-3 anchor, noise without signal. Theignorebelongs on the escalation, not the building block.- A rule anchored too broadly swallows its siblings. The outage
rule matched any
SCANNING_*event as its "current event", so a perfectly successful scan could be reported as part of an outage, eating its own 100415/100416 alert on the way. It now anchors on the blind-spot rules themselves.
The final pack is what survived all of that: 25 rules, three chains, and negative controls baked into the triggers (a clean image pulled inside the correlation window, Harbor's scanner re-pulling the bad image, and two digest-less events), each of which must not fire a chain, and doesn't.
The Wolfi Part: Practicing What the Post Preaches
There's an uncomfortable irony available to anyone who runs this pack's Trivy scan against the images doing the scanning: the mailing lists have threads about Trivy runs on the official Wazuh images failing or lighting up, and the stock Ubuntu/Amazon-Linux-based packaging carries a userland the agent never uses.
Wolfi
is Chainguard's minimal "undistro": glibc, apk, daily-rebuilt
packages, no init system, busybox userland. Chainguard sells hardened
Wazuh images commercially; the repo's wolfi/ directory is the open,
reproducible version for the agent: a two-stage Dockerfile that
compiles the Wazuh agent from source on wolfi-base and ships
/var/ossec on a fresh wolfi-base with four runtime packages
(libgcc, libstdc++, shadow, procps): 184 MB total, agent
enrolled and Active against the lab manager as part of the
validation run.
Four traps, so you don't rediscover them, two at build time, two at runtime:
- Wolfi package naming: there is no standalone
g++ortarpackage: the gcc packages carry g++, and busybox provides tar. Guessing Alpine names gets you unsatisfiable-dependency errors from apk. - Wazuh 4.10 does not compile under GCC 16 (Wolfi's default
toolchain). libstdc++ ≥ 15 stopped transitively including
<cstdint>, soshared_modulesC++ dies with'uint64_t' does not name a type, and then a cascade of overload-conflict errors as everyuint64_tparameter degrades. Wolfi keeps versioned toolchains for exactly this:gcc-13-defaultpins thegcc/g++symlinks to GCC 13, the generation Wazuh 4.10 was developed against, and the build goes through. wazuh-controlderives its install dir from$PWD. The source-installed control script doesDIR=`dirname $PWD`(the packaged .deb hardcodes the path instead). Invoke it from anywhere but/var/ossec/binand it hunts for daemons under the wrong root with baffling errors. The image's entrypointcds first.- busybox
pshas no-p.wazuh-control'spstatus()checks daemons withps -p $pid; under busybox that always fails, so the control script concludes the pid is stale, deletes the live daemon's pid file, and reports "wazuh-execd did not start" while execd is running. Realprocpsin the runtime stage fixes it. (And don'tchown -Rthe copied/var/ossecafterwards:install.shsets deliberate per-directory ownership, and flattening it breaks agentd onqueue/ridswith errno 13.)
The result, scanned by the same Trivy that powers the Harbor side:
A snapshot, not a constant. These counts are a measurement taken
at one moment against one vulnerability database, and they will not
reproduce exactly when you run them. Trivy's DB updates several times
a day; a single new advisory against a base image moves the numbers,
and both directions happen: Wolfi packages are rebuilt daily, and
Wazuh publishes new images too. Treat the table as evidence of a
structural difference in attack surface, not as a scoreboard. The
figures below were produced with Trivy 0.58.1 and its
vulnerability database as of 2026-07-28, scanning
wazuh/wazuh-manager:4.10.0 and agent 4.10.0; wolfi/compare.sh
reproduces the table on your machine, with your DB, on the day you run
it.
| Image | Critical | High | Medium | Low | Total |
|---|---|---|---|---|---|
wazuh/wazuh-manager:4.10.0 (official) |
7 | 303 | 224 | 29 | 567 |
| Ubuntu 22.04 + agent 4.10.0 (lab receiver) | 0 | 0 | 49 | 22 | 71 |
wazuh-agent-wolfi (this repo) |
0 | 0 | 0 | 0 | 0 |
What is durable in that table is not the integer in the last column; it's the shape. The Wolfi image has no shell package, no package manager at runtime, no perl or python in the final stage; the surface those 567 findings are drawn from mostly isn't present, so its count starts near zero and stays there between rebuilds rather than accumulating.
Sit with the first row for a second: on the day of that scan, the official manager image would have failed this pack's own rule 100415: the deployment watching your supply chain pages on itself the moment you point the scanner inward. The point is not that the official images are "bad"; they optimize for compatibility and support surface, and a manager legitimately carries more userland than an agent. The point is that the agent you deploy to watch your supply chain should survive its own pipeline's scan gate, and the Wolfi build clears it with zero findings.
Tuning for Production
The pack ships deliberately loud so the lab shows the full surface. Three knobs before real deployment:
| Rule | Default noise on a real registry | Recommended tuning |
|---|---|---|
| 100412 (pulls) | Very high on busy registries; every node pull is an event. | Level 4 keeps it from paging, but note it is still written to alerts.json: the manager logs level ≥ 3, so this costs storage, not attention. Scope pull webhooks to production projects; the chains keep working because they join on the pull event. |
| 100411/100413/100418 (production project regex) | Zero until you set it. | ^(prod|production|release|platform)$ must match your project naming, or these rules silently never fire. This is the pack's one mandatory config edit. |
| 100415/100416 (CVE severity) | Depends on your base images; a fleet on old bases will page constantly. | Keep 100415 paging, drop 100416 to inventory, and drive the burn-down from the dashboard, or gate CI on Harbor's own "prevent vulnerable images from running" policy and treat 100415 as the audit trail for exceptions. |
| 100401 (bad-auth POSTs) | Low, unless the receiver is internet-exposed (don't). | Keep. If it fires at all outside a Harbor config change, something is probing you. |
And the correlation-window trade-off worth stating plainly, because it
is the pack's real structural limit: the chains use a one-hour
timeframe. A vulnerable image, however, sits in the registry
indefinitely, so every pod restart, scale-out and node replacement
an hour after the scan is a level-4 pull and nothing more. Widening
the window only moves the boundary and grows analysisd's state; the
honest fix is stateful, not temporal: keep known-bad digests in a CDB
list and match pulls against it, so the detection lasts as long as the
image does. That's the next iteration of this pack, and I'd rather
name the gap than let the lab's green output imply it isn't there.
Reproduction
git clone https://github.com/nadimjsaliby/wazuh-container-registry-sensor.git
cd wazuh-container-registry-sensor

docker compose down -v
docker compose up -d --build

until docker exec wazreg-manager /var/ossec/bin/agent_control -l \
        | grep -q 'wazreg-receiver.*Active'; do sleep 2; done

docker exec -it wazreg-receiver bash /opt/lab/triggers/00-fire-all.sh

docker exec wazreg-manager bash -c 'tail -F /var/ossec/logs/alerts/alerts.json' \
  | jq -c 'select(.rule.id|tonumber>=100400 and tonumber<=100440)
           | {id:.rule.id, lvl:.rule.level, d:.rule.description}'
To run against an existing manager: ship
wazuh/rules/local_rules.xml, restart the manager, bring up only the
receiver with WAZUH_MANAGER=<host>, and point your Harbor webhook
policies at http://<receiver>:9000/webhook (per-project; the repo's
harbor/README.md includes the API loop to create them in bulk, plus
the scan-on-push and payload-format settings that matter).
To reproduce the dashboard screenshots above, bring up the official single-node stack and attach the receiver to it with the bundled override:
git clone --depth 1 -b v4.14.5 https://github.com/wazuh/wazuh-docker.git
cd wazuh-docker/single-node
docker compose -f generate-indexer-certs.yml run --rm generator
docker compose -p wazuh-stack up -d
cd -

docker cp wazuh/rules/local_rules.xml wazuh-stack-wazuh.manager-1:/var/ossec/etc/rules/local_rules.xml
docker exec wazuh-stack-wazuh.manager-1 chown wazuh:wazuh /var/ossec/etc/rules/local_rules.xml
docker exec wazuh-stack-wazuh.manager-1 /var/ossec/bin/wazuh-control restart

docker compose -f docker-compose.ext.yml up -d --build
docker exec -it wazreg-receiver-ext bash /opt/lab/triggers/00-fire-all.sh
Then open https://localhost/ and filter Threat Hunting by
rule.groups:harbor. Two traps if you deviate: the official stack
ships authd with <use_password>no</use_password>, so a
password-bearing enrollment is rejected outright (the override passes
an empty password on purpose), and recreating the receiver container
re-enrolls a name the manager already knows: Duplicate agent name,
which needs manage_agents -r <id> before it will come back.
The Wolfi agent:
cd wolfi
docker build -t wazuh-agent-wolfi .
docker run -e WAZUH_MANAGER=<manager> \
           -e WAZUH_REGISTRATION_PASSWORD=<pw> wazuh-agent-wolfi
./compare.sh   # the CVE table, reproduced on your machine
Where to Take This Next
The pack stops at detection on purpose: an alert you understand is worth more than an automation you don't. But every one of these detections is a natural trigger for something, and Wazuh has the plumbing already. Four directions, roughly in order of effort:
Notify where the platform team actually lives. Wazuh's built-in
integrations need no code: a block in ossec.conf scoped by rule ID
or group sends the chains to Slack or a webhook, and leaves the
level-3 inventory alerts in the SIEM where they belong:
<integration>
  <name>slack</name>
  <hook_url>https://hooks.slack.com/services/…</hook_url>
  <group>chain,vulnerable_image,</group>
  <alert_format>json</alert_format>
</integration>
Open a ticket with the evidence attached. The same
<integration> mechanism takes a <name>custom-jira</name> script,
and these alerts carry unusually good ticket bodies: the digest, the
project, the operator, the CVE counts and the scan verdict are all
decoded fields, so the issue can be filed against the owning team with
the artifact identity already in the title.
Close the loop with Active Response. This is where it gets
interesting, because Harbor exposes the levers over its API. An AR
script bound to 100420 can flip the project's "Prevent vulnerable
images from running" policy, revoke the robot account that pulled the
image, or delete the offending tag so the next deployment can't repeat
it. The honest caveat: the pull already happened, so this is
containment, not prevention, which argues for pairing it with the
next item.
Make CI ask the SIEM before it deploys. The chains produce a
durable statement (this digest is known-bad), and a deployment gate
can query it. A pipeline step (or a Kyverno/OPA admission policy) that
checks the Wazuh indexer for a recent 100415/100420 on the digest
it is about to deploy turns a detection into a control, and it
composes directly with the auto-remediation in the Kubernetes Helm
chart post.
That is also the natural home for the CDB list of known-bad digests
the tuning section described, the same data serving detection and
enforcement.
The most useful contribution, though, would be a second registry
adapter. The rules match on harbor.* fields the bridge produces,
not on anything Harbor-specific in the rule logic, so a GitLab
Container Registry, Quay or ECR adapter emitting the same normalized
JSON would reuse all 25 rules unchanged. That is the part I'd most
like to see someone else build.
Why Wazuh
The engine requirements for registry-as-a-sensor are narrower than the previous posts' (no FIM, no command wodles), but they're the ones Wazuh happens to do with zero glue:
- Stock JSON ingestion: one
<localfile>block, no decoders, and every bridge field is matchable. The entire parsing layer of this integration is the 150-line bridge script. - Stateful correlation with field joins:
<if_matched_sid>+<same_field>expresses "scan said critical, then the same image was pulled" in five lines of XML. Doing this in a stateless webhook-to-Slack forwarder is impossible; doing it in a stream processor is a deployment. - Severity supersession: the burst and chain rules automatically swallow their building blocks, so the analyst sees one level-14 alert, not four fragments of it.
- One receiver, any number of registries: webhook policies from every Harbor project (or several Harbor instances) converge on one agent, and the manager holds the rules.
The three posts in this series now cover the container lifecycle end to end: this post watches what enters the registry and what leaves it; the Helm chart governs what runs; the Tetragon sidecar watches what it does at the kernel. Same manager, same rule namespace, no overlap.
Resources
- Wazuh: the open source security platform, unified XDR and SIEM protection
- Wazuh Ambassadors Program
- Repository + lab:
nadimjsaliby/wazuh-container-registry-sensor - Harbor: webhook notifications
- Harbor: vulnerability scanning with Trivy
- Trivy: aquasecurity/trivy
- Wolfi: wolfi-base image
- Wazuh Documentation: JSON log decoding
- Wazuh Documentation: Custom Rules
- Wazuh blog: Container image security with Wazuh and Trivy (the endpoint-side approach this post complements)
- MITRE ATT&CK: T1195.002 Compromise Software Supply Chain
- MITRE ATT&CK: T1525 Implant Internal Image
- MITRE ATT&CK: T1190 Exploit Public-Facing Application
- MITRE ATT&CK: T1070 Indicator Removal
- MITRE ATT&CK: T1110 Brute Force
This post was produced for the Wazuh Ambassadors Program. Wazuh is a free, open source security platform.