Wazuh on K8s: 7 Frameworks, Auto-Remediation, One Chart
Most teams running Wazuh on Kubernetes stitch together five separate tools to get compliance coverage that still has gaps. One tool scans CIS benchmarks. Another handles admission policies. A third runs vulnerability checks. Remediation is manual. Reports are spreadsheets. None of them share context, and when an auditor asks whether a single kubelet misconfiguration also fails NIST, PCI, and HIPAA controls — nobody can answer without hours of cross-referencing.
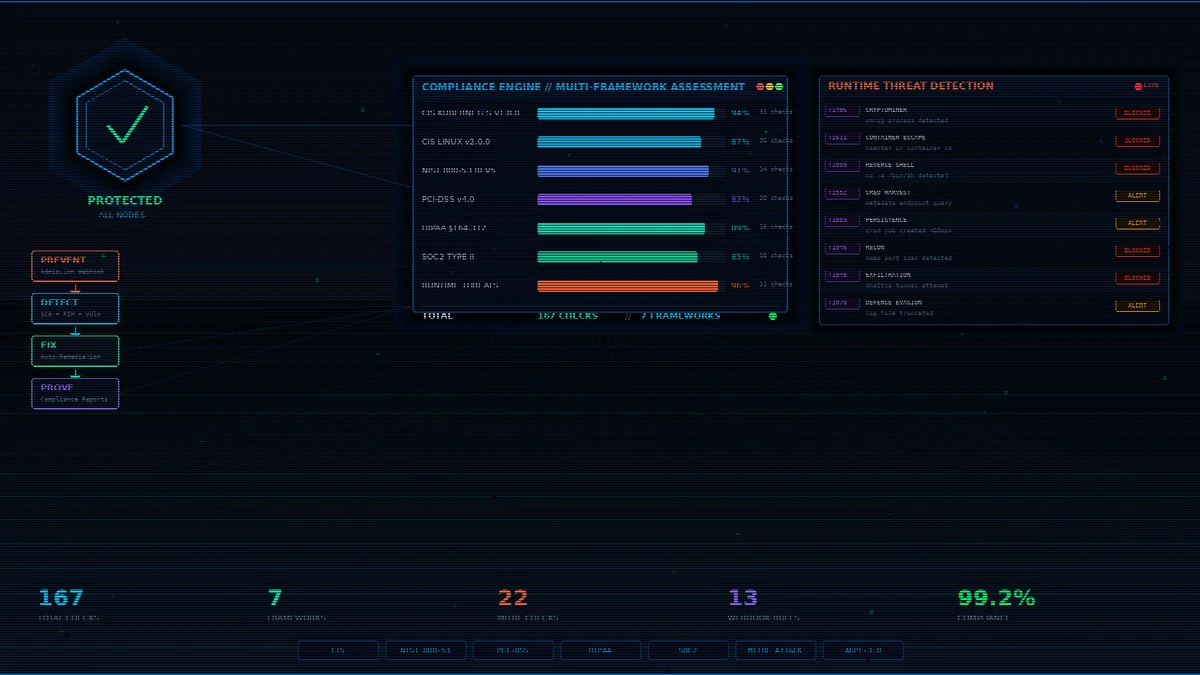
I built a single Helm chart that wraps a standard Wazuh agent deployment and adds the missing Kubernetes-native pieces on top — admission-time enforcement, automated remediation, Prometheus-native observability, and scheduled compliance reports — so one helm install covers the full prevent → detect → fix → prove lifecycle. 167 SCA checks across 7 compliance frameworks, MITRE ATT&CK-mapped runtime detection, admission webhook, Prometheus metrics, Grafana dashboard, audit-ready compliance reports.
This post is a technical deep-dive. Because Wazuh is the engine doing most of the heavy lifting, I want to be explicit up front about what’s native Wazuh and what this chart adds on top — that boundary matters if you’re trying to understand which parts you’d get out of the box versus what the chart contributes.
What’s native Wazuh vs. what this chart adds
| Capability | Origin |
|---|---|
| SCA scanning engine (evaluating policy YAML against hosts/containers) | Wazuh (native) |
| FIM (File Integrity Monitoring) | Wazuh (native) |
| Vulnerability detection | Wazuh (native) |
| Rootcheck, log collection, syscheck | Wazuh (native) |
| Active response framework (Wazuh’s built-in remediation hooks) | Wazuh (native) |
compliance: field in SCA YAML (cross-reference per check) | Wazuh (native) |
| Agent ↔ Manager architecture, dashboard, API | Wazuh (native) |
| MITRE ATT&CK tagging on rules/alerts | Wazuh (native, via mitre field) |
| Bundled SCA policy file content — 167 checks across 7 frameworks | This chart |
| Bundled runtime threat policy YAML with MITRE-mapped detections | This chart (policy content fed to Wazuh’s SCA engine) |
ValidatingWebhookConfiguration + admission policy engine | This chart — not part of Wazuh |
Auto-remediation CronJob with host-level file/sysctl/SSH/auditd fixes | This chart (broader scope than Wazuh’s active response) |
Compliance reporting CronJob → JSON / HTML / CSV → S3 / email | This chart |
| Prometheus metrics exporter sidecar + PrometheusRule alerts | This chart (Wazuh doesn’t ship a Prometheus exporter) |
| Grafana dashboard | This chart |
| K8s self-hardening (NetworkPolicy, PDB, seccomp, RBAC, cert-manager) | This chart |
| Helm packaging, values schema, lifecycle hooks | This chart |
Short version: Wazuh’s SCA engine, FIM, vulnerability scanner, active response, and MITRE-tagged alerting are doing the detection and compliance work. This chart packages bundled policy content for 7 frameworks, plus the K8s-native pieces Wazuh doesn’t ship (admission webhook, Prometheus exporter, reporting CronJob, remediation CronJob, self-hardening manifests) into a single deploy.
The problem with the current state
Here’s what most teams are running today:
- A Wazuh or Falco DaemonSet for detection
- OPA/Gatekeeper or Kyverno for admission policies
- A separate CIS scanner (kube-bench) as a CronJob
- Manual remediation or Ansible playbooks triggered by humans
- Compliance reports generated in spreadsheets by hand
These tools don’t share context. A CIS check that fails on the kubelet doesn’t automatically map to the NIST 800-53 control it satisfies. The admission webhook doesn’t know what the SCA scanner found. The remediation is always manual.
The result: compliance drift, audit fatigue, and a false sense of security.
Architecture: one chart, full lifecycle
                         ┌──────────────────────────┐
    Deploy ──────►│   Admission Webhook      │ ─── PREVENT  (chart-added)
                  │   Block before it runs   │
                  └────────────┬─────────────┘
                               │
                  ┌────────────▼─────────────┐
    Runtime ─────►│   Wazuh Agent DaemonSet  │ ─── DETECT   (Wazuh-native)
                  │   SCA + FIM + Vuln + RT  │
                  └────────────┬─────────────┘
                               │
                  ┌────────────▼─────────────┐
    CronJob ─────►│   Auto-Remediation       │ ─── FIX      (chart-added,
                  │   File perms, kernel,    │              complements Wazuh
                  │   SSH, auditd, modules   │              active response)
                  └────────────┬─────────────┘
                               │
                  ┌────────────▼─────────────┐
    Scheduled ───►│   Compliance Reports     │ ─── PROVE    (chart-added)
                  │   JSON / HTML / CSV      │
                  │   S3 upload + email      │
                  └──────────────────────────┘
Prevent (chart-added). A ValidatingWebhookConfiguration intercepts every pod, deployment, statefulset, daemonset, job, and cronjob at admission time. It blocks privileged containers, host namespace access, privilege escalation, :latest tags, missing required labels, and unauthorized registries. This is not a Wazuh feature — it’s a standard Kubernetes admission webhook this chart deploys alongside the Wazuh agents.
Detect (Wazuh-native, with chart-bundled policies). Wazuh agents run Wazuh’s SCA engine against seven policy files simultaneously. The SCA engine, the scheduling, the alert pipeline back to the manager — all native Wazuh. What the chart contributes here is the policy content: 167 checks written in Wazuh’s SCA YAML format, with compliance: cross-references that Wazuh evaluates and tags on every finding.
Fix (chart-added CronJob). Wazuh has a built-in active response framework for triggering reactions to alerts (block IPs, kill processes, etc.). This chart adds a separate, broader-scope CronJob that runs every 6 hours (configurable) and remediates infrastructure findings the active response framework isn’t designed for: file permissions, kernel sysctl, SSH hardening, unused kernel modules, auditd rules. It starts in dry-run mode by default.
Prove (chart-added CronJob). A weekly CronJob queries the Wazuh manager API (native), aggregates findings into JSON, HTML, and CSV reports, and ships them to S3 or email. The query is against Wazuh’s API; the report shaping, multi-framework breakdown, and delivery are chart logic.
Seven frameworks, one scan
This is where the compliance: field in Wazuh’s SCA YAML does the heavy lifting. The mechanism is native Wazuh; the content (which controls map to which checks) is what the chart bundles.
| Framework | Controls | What it checks |
|---|---|---|
| CIS Kubernetes v1.8.0 | 31 (L1 + L2) | API server config, kubelet hardening, etcd security, RBAC, network policies |
| CIS Linux v2.0.0 | 36 (L1 + L2) | Filesystem, network params, SSH, logging, file permissions, password policy |
| NIST 800-53 Rev5 | 24 | AC, AU, CM, IA, SC, SI control families mapped to K8s and OS checks |
| PCI-DSS v4.0 | 20 | Network segmentation, encryption at rest/transit, access control, FIM, audit trails |
| HIPAA §164.312 | 16 | Access control, audit controls, integrity, authentication, transmission security |
| SOC2 Type II | 18 | CC6–CC8 trust criteria, availability, change management |
| Runtime Threats | 22 | MITRE ATT&CK mapped: cryptomining, container escape, reverse shells, persistence |
Total: 167 checks per scan cycle.
The critical detail is cross-framework mapping via the native compliance: field. Take kubelet anonymous authentication:
       # Excerpt from the chart's bundled CIS Kubernetes policy file —
# fed to Wazuh's SCA engine, which evaluates the rules and emits the
# compliance metadata on every resulting finding.
- id: 50400
  title: "IA-2: kubelet anonymous auth disabled"
  description: "The kubelet should reject anonymous requests..."
  rationale: "Anonymous authentication of the kubelet API permits any unauthorized caller..."
  remediation: "Set --anonymous-auth=false in kubelet config and restart."
  compliance:
    - cis_kubernetes: ["4.2.1"]
    - cis: ["4.2.1"]
    - nist_800_53: ["IA-2"]
    - pci_dss: ["2.2.1"]
    - hipaa: ["164.312(a)(2)(i)"]
    - soc2: ["CC6.1"]
  condition: any
  rules:
    - 'f:/var/lib/kubelet/config.yaml -> r:authentication: -> r:anonymous: -> r:enabled: false'
When this check fails, Wazuh’s SCA engine emits a single finding with all six compliance tags attached. One scan, one alert, six frameworks accounted for — that’s not custom mapping logic; that’s Wazuh’s native SCA behavior, fed with policy content that has the cross-references encoded.
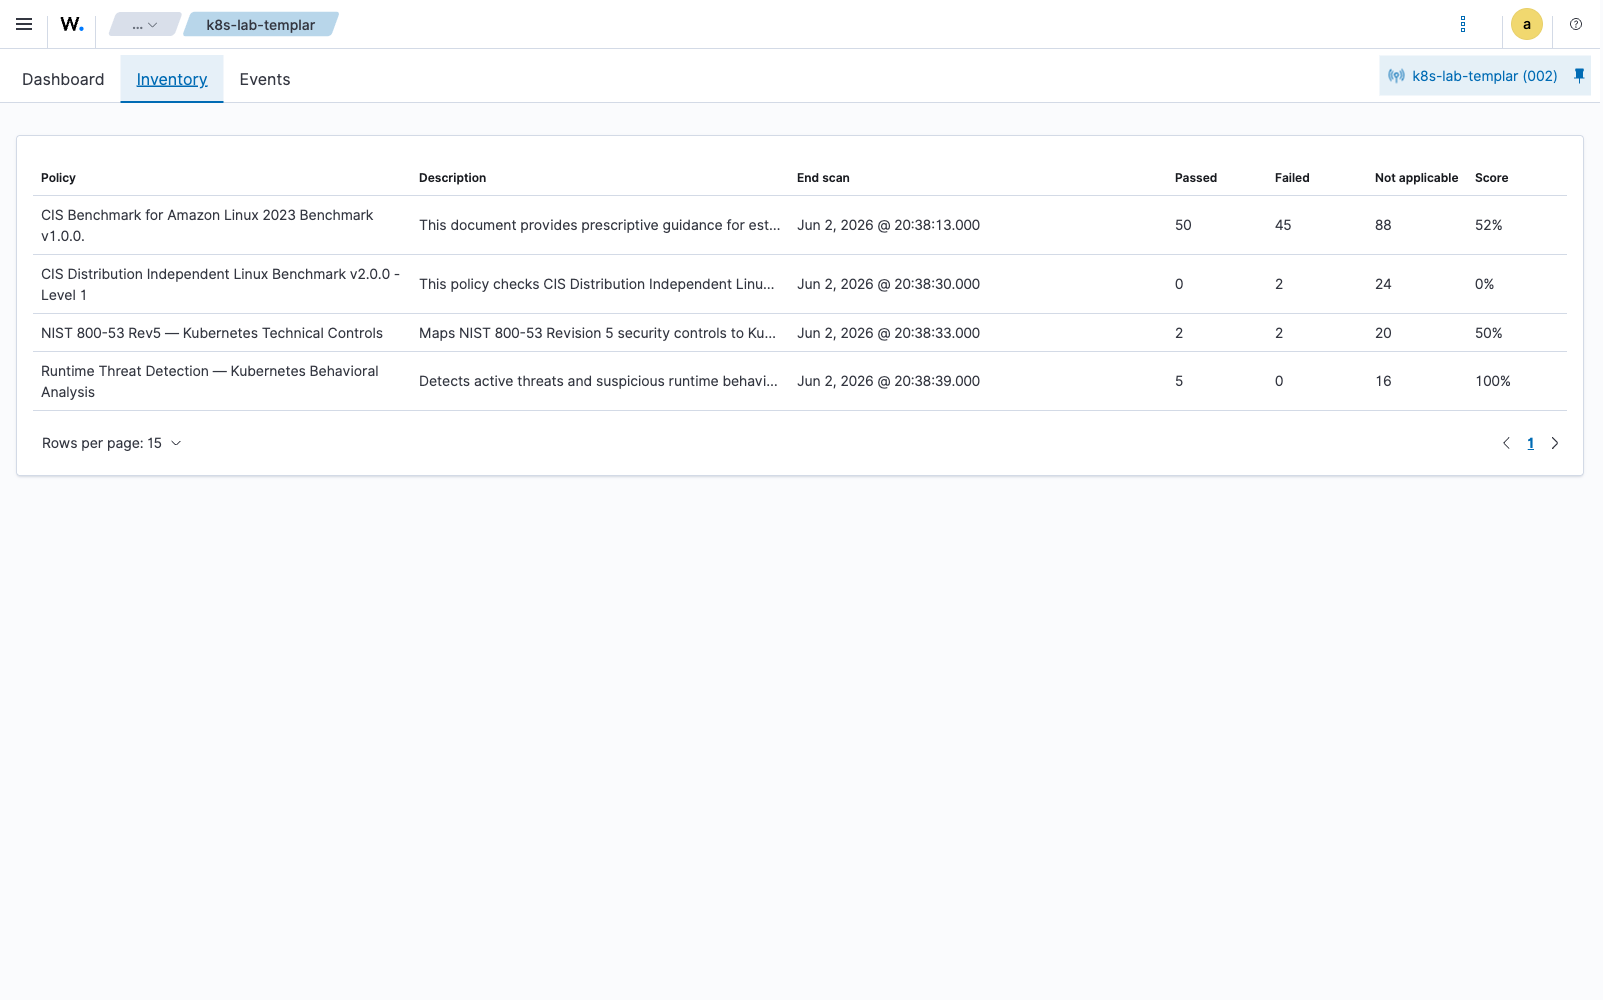
Here’s what the live data looks like. The snippet below is the actual JSON returned by GET /sca/{agent_id} against a Wazuh manager (4.14.5) running this chart on a single-node K8s cluster, showing four of the bundled policies loaded simultaneously on one agent:
       {
  "data": {
    "affected_items": [
      {
        "policy_id": "runtime_threat_detection",
        "name": "Runtime Threat Detection — Kubernetes Behavioral Analysis",
        "total_checks": 21, "pass": 5, "fail": 0, "invalid": 16,
        "score": 100,
        "start_scan": "2026-06-02T17:38:39+00:00",
        "end_scan":   "2026-06-02T17:38:39+00:00"
      },
      {
        "policy_id": "nist_800_53_k8s",
        "name": "NIST 800-53 Rev5 — Kubernetes Technical Controls",
        "total_checks": 24, "pass": 2, "fail": 2, "invalid": 20,
        "score": 50
      },
      {
        "policy_id": "cis_linux_l1",
        "name": "CIS Distribution Independent Linux Benchmark v2.0.0 - Level 1",
        "total_checks": 26, "pass": 0, "fail": 2, "invalid": 24,
        "score": 0
      },
      {
        "policy_id": "cis_amazon_linux_2023",
        "name": "CIS Benchmark for Amazon Linux 2023 Benchmark v1.0.0.",
        "total_checks": 183, "pass": 50, "fail": 45, "invalid": 88,
        "score": 52
      }
    ]
  }
}
That’s four chart-bundled policies evaluated by the same Wazuh SCA engine, in the same scan cycle, against the same agent. The invalid count comes mostly from checks gated on sca.remote_commands=yes (more on that below). The score and per-policy totals are exactly what the Wazuh dashboard renders in Configuration Assessment → Inventory:
Runtime threat detection: MITRE ATT&CK mapped
Wazuh’s SCA engine isn’t only for compliance baselines — it can evaluate any rules-based policy. This chart ships a runtime threats policy file (chart-added content) that uses the same SCA engine (Wazuh-native) to look for indicators of compromise, with each check tagged with the relevant MITRE ATT&CK technique.
The detection mechanism — process inspection (p:), port checks (c:+regex), command execution rules (c:), file inspection (f:) — is all native to the Wazuh SCA YAML format. What’s chart-added is the curated set of 22 detection rules and their MITRE mappings.
Below is what the policy and a real evaluated check look like. The first block is the source YAML for check 90100 shipped by the chart; the second block is the exact JSON the Wazuh API returns for that check after a scan against the live lab agent — note that Wazuh’s SCA engine has lifted the MITRE technique into the compliance array on the finding, and reproduced every individual p: rule with its match type. That’s the native engine doing the work; the chart provided the content.
       # policies/runtime/runtime_threat_detection.yml — bundled by the chart
- id: 90100
  title: "Cryptominer process detection — xmrig"
  description: "Detect running xmrig or known cryptocurrency mining processes."
  rationale: "Cryptojacking is the most common attack in Kubernetes. MITRE ATT&CK T1496."
  remediation: "Kill the mining process. Investigate the container image and deployment source. Rotate compromised credentials."
  compliance:
    - mitre_attack: ["T1496"]
  condition: none
  rules:
    - "p:xmrig"
    - "p:minerd"
    - "p:cpuminer"
    - "p:minergate"
    - "p:ethminer"
    - "p:cgminer"
    - "p:bfgminer"
    - "p:nbminer"
    - "p:t-rex"
    - "p:gminer"
    - "p:lolminer"
// GET /sca/{agent_id}/checks/runtime_threat_detection?q=id=90100
{
"policy_id": "runtime_threat_detection",
"id": 90100,
"title": "Cryptominer process detection — xmrig",
"description": "Detect running xmrig or known cryptocurrency mining processes.",
"rationale": "Cryptojacking is the most common attack in Kubernetes. MITRE ATT&CK T1496.",
"remediation": "Kill the mining process. Investigate the container image and deployment source. Rotate compromised credentials.",
"process": "xmrig,minerd,cpuminer,minergate,ethminer,cgminer,bfgminer,nbminer,t-rex,gminer,lolminer",
"condition": "none",
"result": "passed",
"compliance": [
{ "key": "mitre_attack", "value": "T1496" }
],
"rules": [
{ "rule": "p:xmrig", "type": "process" },
{ "rule": "p:minerd", "type": "process" },
{ "rule": "p:cpuminer", "type": "process" },
{ "rule": "p:nsenter", "type": "process" }
/* ... 7 more rules elided ... */
]
}If a miner process were present at scan time, the only field that changes is "result": "failed" — and a wazuh-rule event also flows through the alert pipeline with the same MITRE tag attached.
The full check coverage and an operational caveat
The runtime policy contains 22 checks spanning seven attacker techniques. After a scan, the agent reports one of three outcomes per check:
| Outcome | What it means |
|---|---|
passed | The check’s condition is satisfied (e.g., condition: none and no matching process was found) |
failed | The check matched — an indicator of compromise is present |
not applicable | The check is gated on a runtime feature the agent isn’t allowed to use |
The 22 checks break down by detection primitive:
| Primitive | Checks | Examples |
|---|---|---|
p: (process inspection) | 5 | xmrig miners, nsenter, reverse-shell tools (nc -e, socat TCP), nmap/masscan, DNS-tunnel tools (iodine, dnscat) |
c: (command execution + regex) | 17 | stratum-port detection via ss -tnp, host-mount checks via mount, cgroup escape via find /sys/fs/cgroup, SA-token theft via grep -l serviceaccount, cloud-metadata calls via ss, cron/systemd persistence via find -mmin -60, log-tampering via find -name *.log -empty |
Operational caveat — and this matters. The 17 c: checks evaluate by running shell commands inside the agent and matching their output against a regex. Wazuh disables this by default (sca.remote_commands=no in the agent’s internal_options.conf) because letting a remote-managed policy execute arbitrary shell on every node is an attack surface in itself. With the default setting, a live agent will return checks like this in the API:
       {
  "policy_id": "runtime_threat_detection",
  "id": 90201,
  "title": "Container escape — Host mount abuse",
  "command": "mount",
  "condition": "none",
  "result": "not applicable",
  "reason": "Ignoring check for running command 'mount'. The internal option 'sca.remote_commands' is disabled",
  "compliance": [ { "key": "mitre_attack", "value": "T1611" } ],
  "rules": [
    { "rule": "c:mount -> r:containerd.sock", "type": "command" },
    { "rule": "c:mount -> r:docker.sock",     "type": "command" }
  ]
}
To enable the full 22-check coverage, the operator has to opt in by adding sca.remote_commands=yes to /var/ossec/etc/local_internal_options.conf on the agent (or via the chart’s agent.internalOptions override). The chart bundles the policy with the c: checks present but does not enable command execution for you — that’s a per-cluster security decision the operator has to make consciously. The 5 process-only checks (p:xmrig, p:nsenter, p:nc -e, p:nmap, p:iodine) work without the flag.
This is exactly the kind of native-Wazuh behavior that’s worth understanding before you deploy: Wazuh ships the safe default; the chart ships content that takes advantage of the unsafe-but-more-powerful option if you turn it on. Either way, the engine is Wazuh’s.
What lives in the policy
By MITRE technique:
- T1496 — Resource Hijacking (cryptomining): 11 miner process names, stratum protocol ports (3333, 4444, 8333, 14444, 45700), CPU-saturation indicator
- T1611 — Container escape:
nsenterprocess, host-mount socket abuse, cgrouprelease_agent(CVE-2022-0492 style), privileged container detection - T1059 — Reverse shells: shell processes with socket redirects,
ncat/ncwith-e,socat TCP - T1552 — Credential access: SA-token reads from
/proc, cloud-metadata endpoint, SSH-key scanning - T1053 / T1543 / T1554 — Persistence: recently created cron jobs, modified system binaries, new systemd service files
- T1046 / T1613 — Reconnaissance:
nmap/masscan/zmapprocesses, kubectl SA-token enumeration - T1048 — Exfiltration: DNS-tunnel tools (
iodine,dnscat,dns2tcp), large outbound connections - T1070 — Defense evasion: truncated logs, cleared bash history
When any of these fire, the resulting Wazuh alert carries the MITRE technique ID natively — Wazuh’s rule engine attaches mitre.id, mitre.tactic, and mitre.technique automatically, so the alert is correlatable in Wazuh’s dashboard, in the API, and in any downstream SIEM.
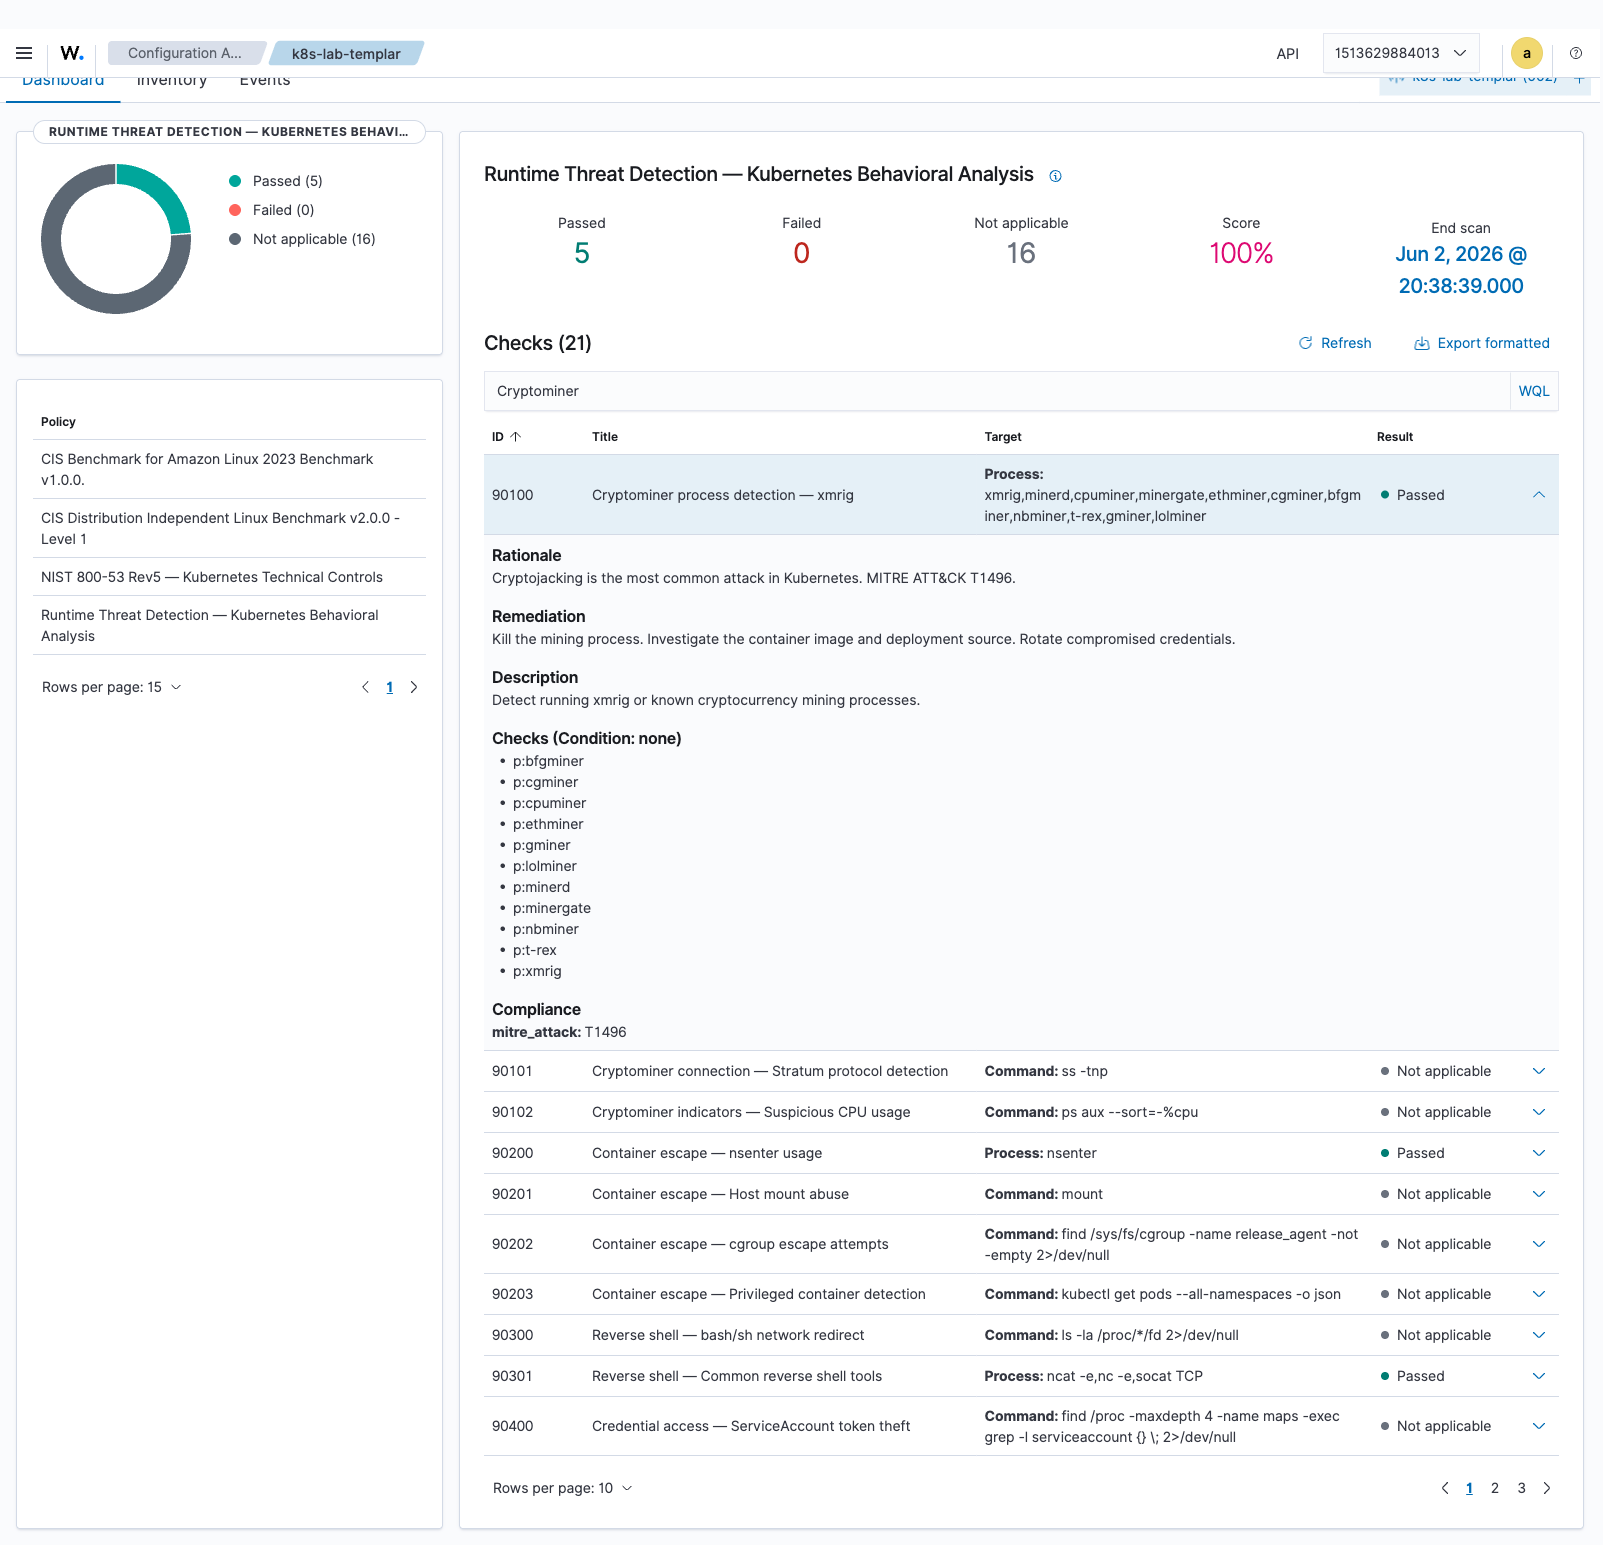
The next screenshot is the Configuration Assessment view for the runtime_threat_detection policy on the live lab agent — Wazuh has loaded the chart-supplied YAML and is rendering all 21 checks with their evaluation results. Note the 5 passed / 0 failed / 16 not applicable counts (matching the API response above), and the mix of p:-rule checks (Passed — the rule evaluated and didn’t match) versus c:-rule checks (Not applicable — gated by sca.remote_commands):
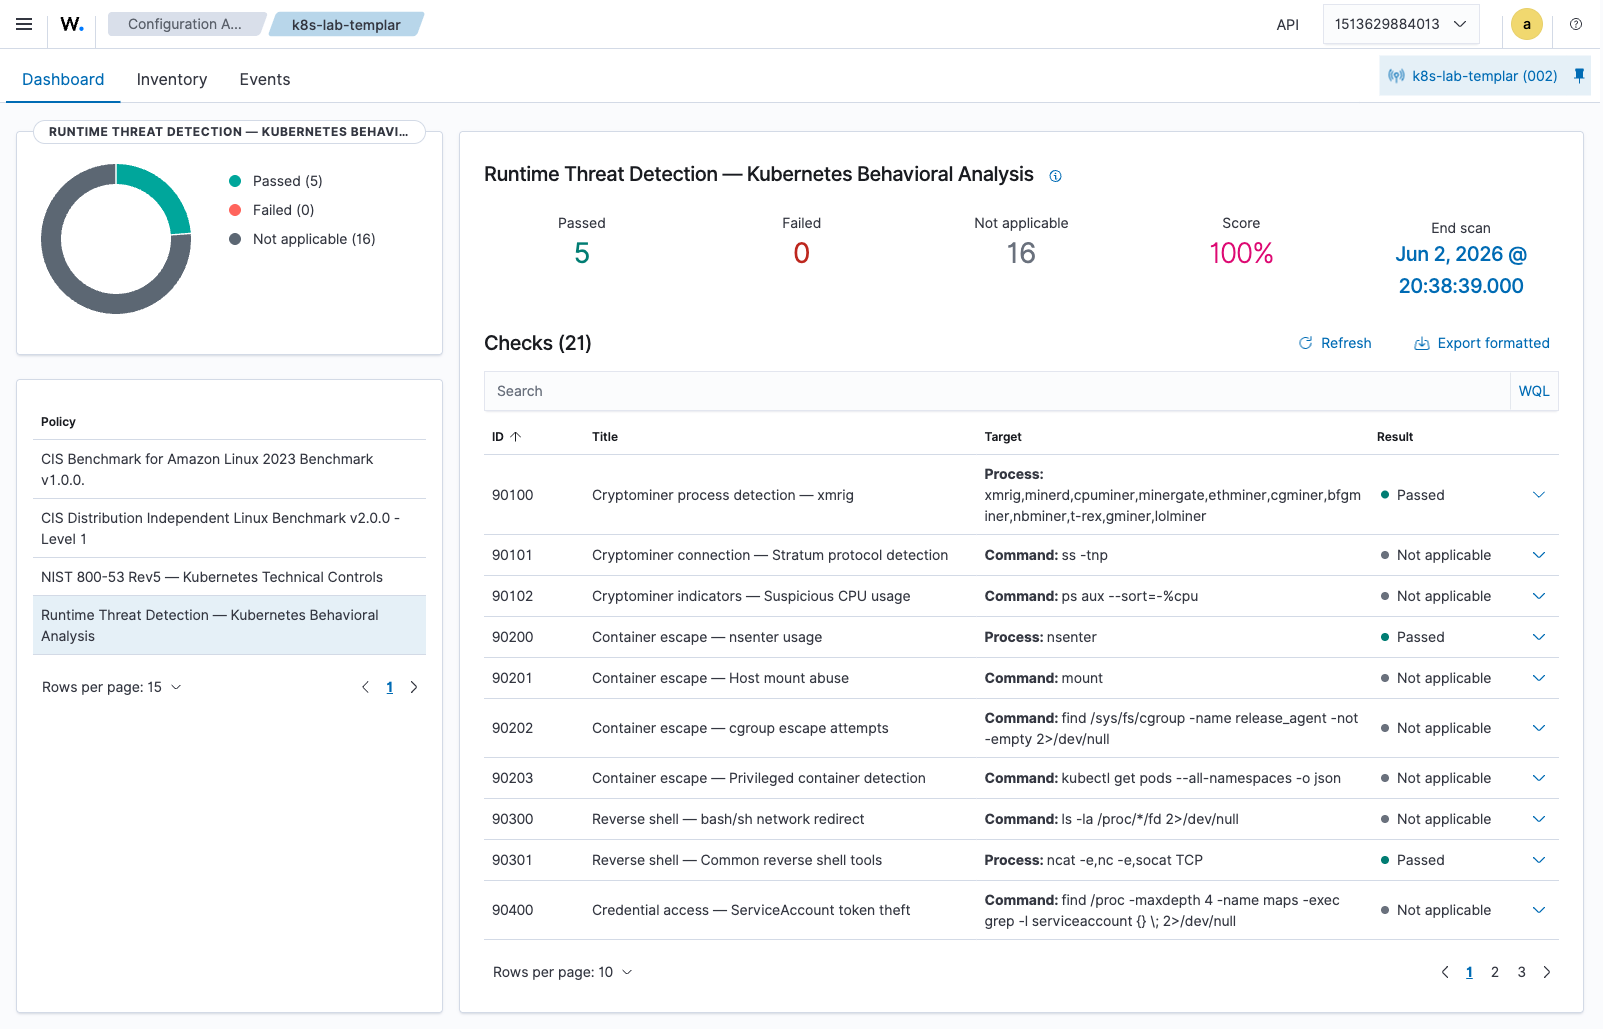
Expanding the cryptominer row exposes the full check metadata Wazuh has parsed out of the chart’s YAML — the rationale, the remediation, the MITRE technique compliance tag, and every individual p: rule the engine evaluated:
What a real finding looks like end-to-end
Here are three actual failing checks captured from the lab agent — one each from the NIST 800-53, CIS Linux, and CIS Amazon Linux policies. These are not constructed examples; they’re the raw API response from GET /sca/{agent_id}/checks/{policy_id}?result=failed against the running deployment, lightly trimmed for length.
NIST 800-53 — IA-5: Password expiration not configured
       {
  "policy_id": "nist_800_53_k8s",
  "id": 50401,
  "title": "IA-5: Authenticator Management — Password expiration configured",
  "description": "Ensure password maximum age is set to 365 days or less.",
  "rationale": "NIST IA-5 governs authenticator lifecycle management.",
  "remediation": "Set PASS_MAX_DAYS 365 in /etc/login.defs.",
  "file": "/etc/login.defs",
  "condition": "all",
  "result": "failed",
  "compliance": [
    { "key": "cis",         "value": "5.5.1.1" },
    { "key": "nist_800_53", "value": "IA-5" }
  ],
  "rules": [
    {
      "rule": "f:/etc/login.defs -> n:PASS_MAX_DAYS\\s+(\\d+) compare <= 365",
      "type": "file"
    }
  ]
}
Same underlying check, evaluated once, tagged with both CIS 5.5.1.1 and NIST 800-53 IA-5. That’s the cross-framework story the chart’s compliance metadata enables — an auditor asking “show me your NIST IA-5 evidence” and an auditor asking “show me your CIS L1 password policy evidence” both land on this same finding.
CIS Amazon Linux 2023 — AIDE intrusion detection missing
       {
  "policy_id": "cis_amazon_linux_2023",
  "id": 31030,
  "title": "Ensure AIDE is installed.",
  "description": "Advanced Intrusion Detection Environment (AIDE) is a intrusion detection tool that uses predefined rules to check the integrity of files and directories in the Linux operating system...",
  "remediation": "Run the following command to install AIDE: # dnf install aide ...",
  "command": "rpm -q aide",
  "condition": "all",
  "result": "failed",
  "compliance": [
    { "key": "cis",                "value": "1.3.1" },
    { "key": "cis_csc_v8",         "value": "3.14" },
    { "key": "cmmc_v2.0",          "value": "AC.L2-3.1.7" },
    { "key": "hipaa",              "value": "164.312(b),164.312(c)(1),164.312(c)(2)" },
    { "key": "iso_27001-2013",     "value": "A.12.4.3" },
    { "key": "mitre_techniques",   "value": "T1565,T1565.001" },
    { "key": "nist_sp_800-53",     "value": "AU-2" },
    { "key": "pci_dss_v3.2.1",     "value": "10.2.1,11.5" },
    { "key": "pci_dss_v4.0",       "value": "10.2.1,10.2.1.1" },
    { "key": "soc_2",              "value": "CC6.1" }
  ],
  "rules": [
    { "rule": "c:rpm -q aide -> r:aide-", "type": "command" }
  ]
}
Ten frameworks satisfied (or failed, in this case) by one check running once. This is what the “one scan, many frameworks” claim looks like in practice — and again, the engine doing the tagging is Wazuh’s native SCA module; the chart provided the YAML.
CIS Linux L1 — Password minimum days
       {
  "policy_id": "cis_linux_l1",
  "id": 30511,
  "title": "Ensure minimum days between password changes is configured",
  "file": "/etc/login.defs",
  "remediation": "Set PASS_MIN_DAYS 1 in /etc/login.defs.",
  "condition": "all",
  "result": "failed",
  "compliance": [
    { "key": "cis",        "value": "5.5.1.2" },
    { "key": "cis_csc_v8", "value": "5.2"    }
  ],
  "rules": [
    {
      "rule": "f:/etc/login.defs -> n:PASS_MIN_DAYS\\s+(\\d+) compare >= 1",
      "type": "file"
    }
  ]
}
Notice the same f: file-inspection primitive as the runtime policy uses — and the same compliance: field shape. Compliance scanning and runtime threat detection share the exact same Wazuh SCA engine; only the policy content differs.
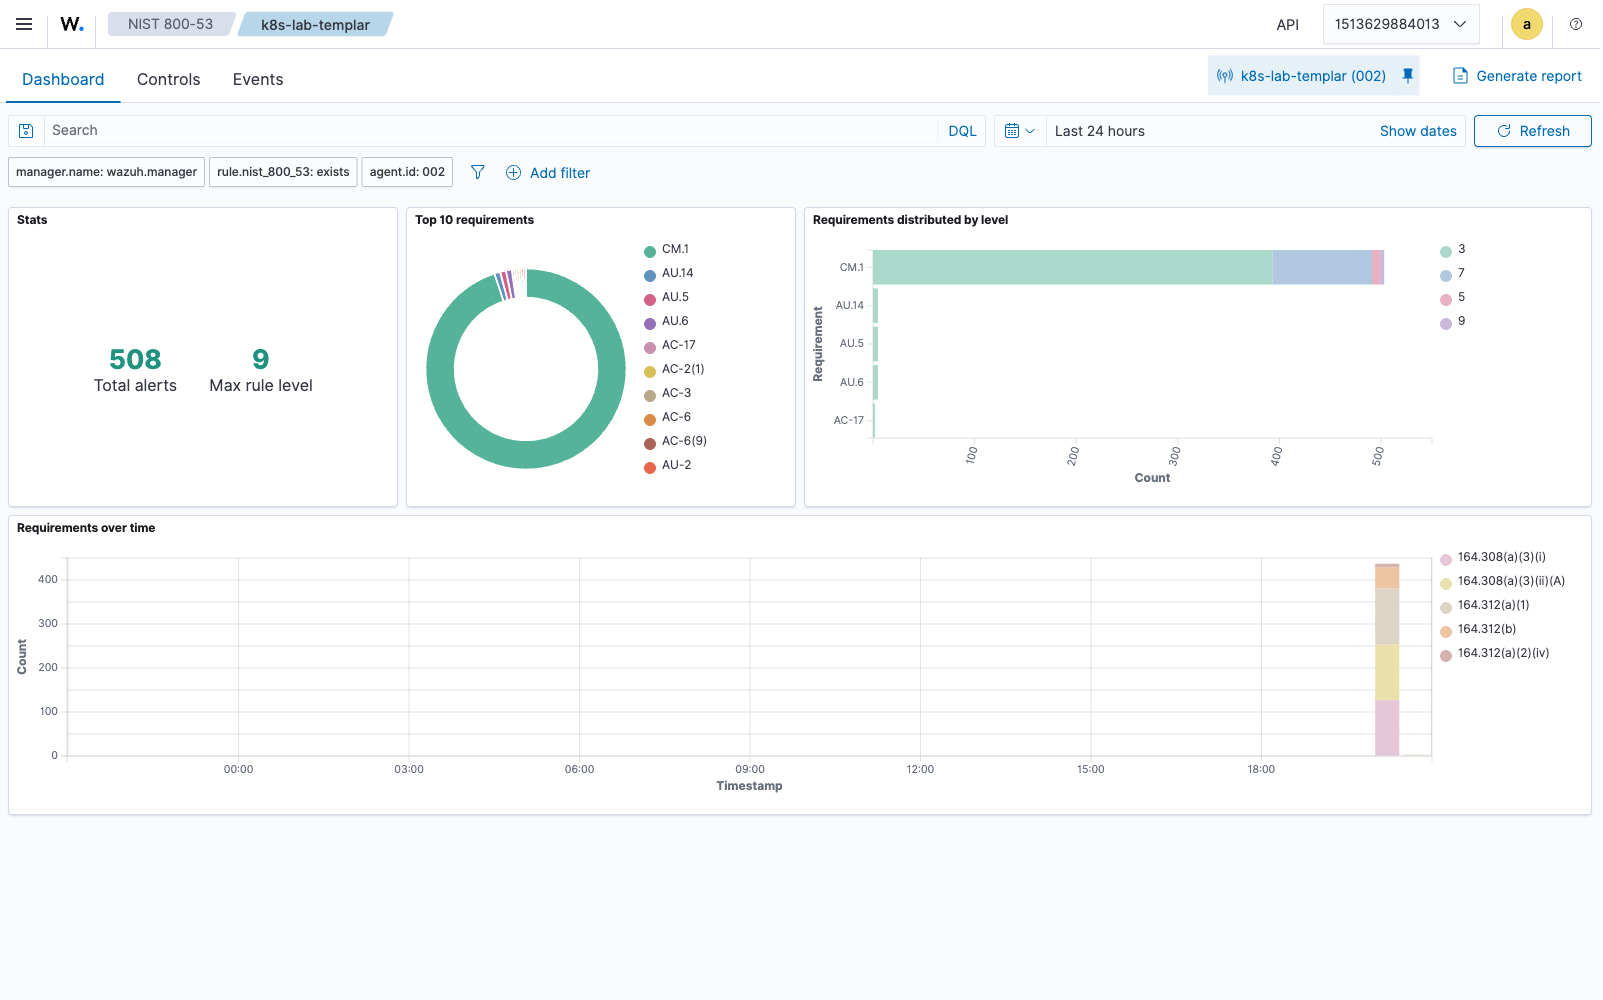
Wazuh’s built-in framework dashboards pick up the compliance: tags directly. Here’s the NIST 800-53 dashboard for the lab agent, populated entirely by the chart-bundled NIST policy:
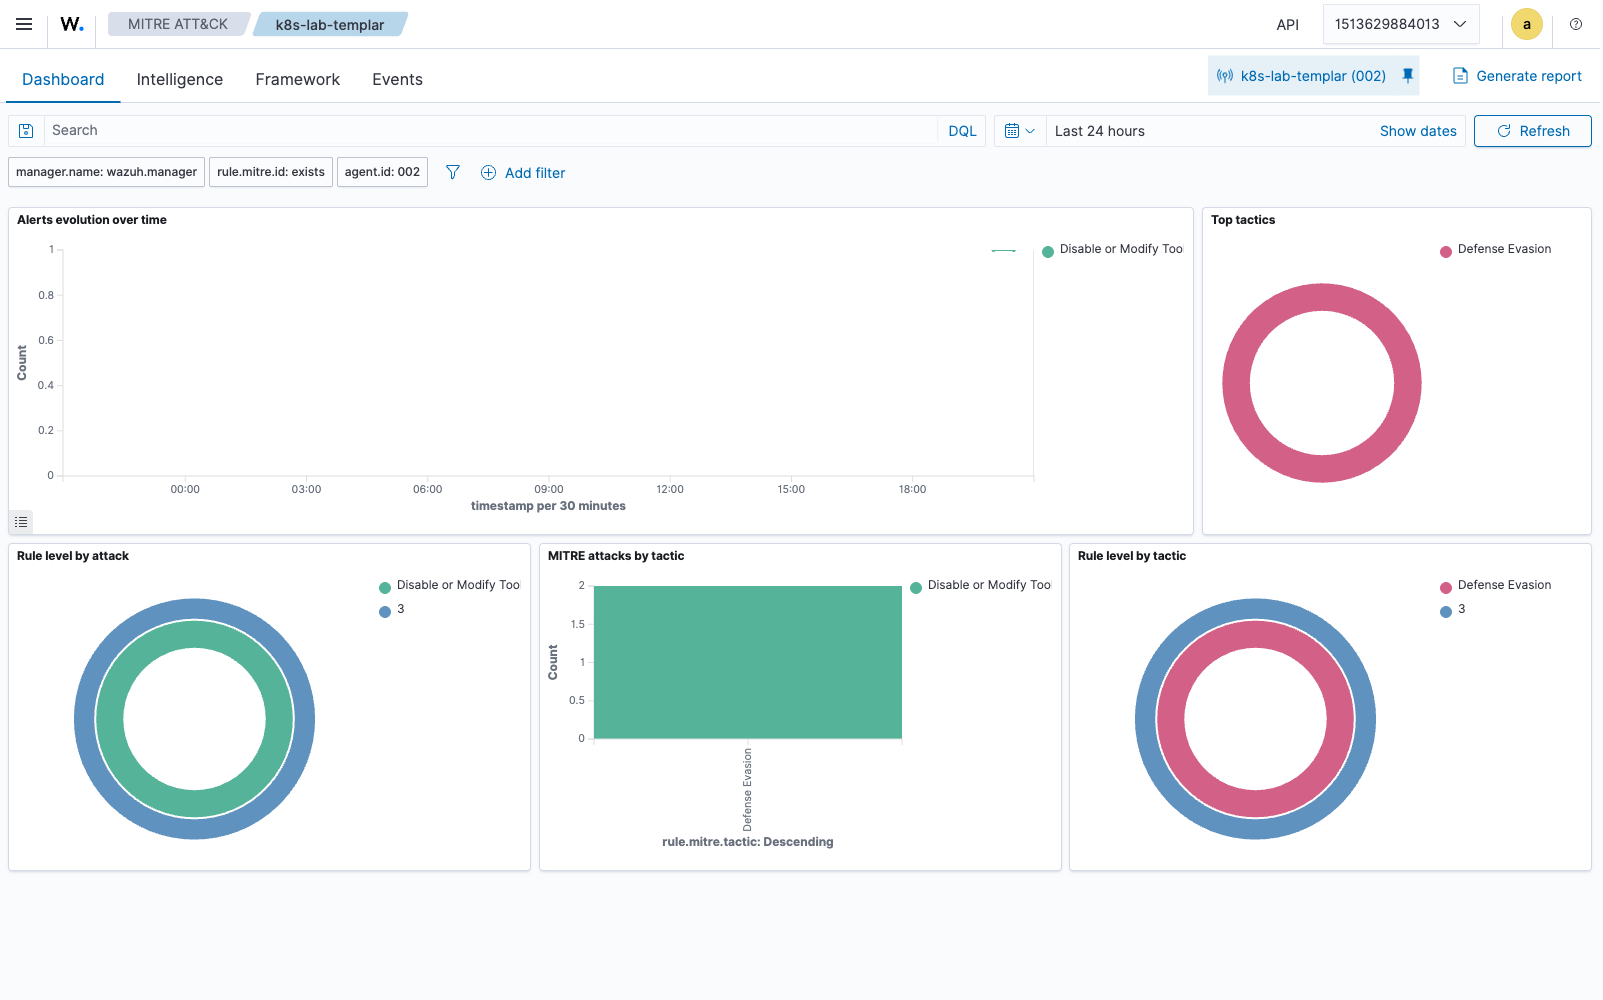
And the MITRE ATT&CK dashboard, populated by the mitre_attack tags the runtime policy emits:
The admission webhook: shift-left enforcement
This is the part with no Wazuh involvement — it’s a standard Kubernetes ValidatingWebhookConfiguration this chart deploys alongside the agents. Detection (Wazuh’s job) is reactive; this webhook is proactive — it prevents non-compliant workloads from running in the first place.
It’s a separate HA deployment (default 2 replicas with topology spread constraints) with its own ServiceAccount, RBAC, NetworkPolicy, PDB, and cert-manager TLS certificate.
The policy engine evaluates 13 rules:
       {
  "blockPrivileged": true,
  "blockHostNetwork": true,
  "blockHostPID": true,
  "blockHostIPC": true,
  "requireRunAsNonRoot": true,
  "blockPrivilegeEscalation": true,
  "blockLatestTag": true,
  "requireImageDigest": false,
  "requiredLabels": ["app.kubernetes.io/name", "app.kubernetes.io/version"],
  "blockedImageRegistries": [],
  "allowedImageRegistries": []
}
The webhook is self-hardened: non-root (UID 65534), read-only root filesystem, all capabilities dropped, seccomp RuntimeDefault, NetworkPolicy restricting traffic to only the API server. Failure policy defaults to Ignore (fail-open) so a webhook outage doesn’t block deployments — switchable to Fail for strict environments.
The exemption system is critical for production. The chart’s own namespace and service account are automatically exempted, along with kube-system, kube-public, and kube-node-lease. You can’t accidentally lock yourself out.
Auto-remediation: from detection to action
Wazuh ships active response, which lets you bind scripts to alerts and trigger them automatically. It’s powerful, but it’s optimized for event-driven, alert-by-alert responses (block IP, kill process, restart service).
This chart adds a separate, broader-scope CronJob that periodically applies host-level hardening that’s not a natural fit for active-response semantics. The two complement each other; the CronJob doesn’t replace active response.
The CronJob runs as privileged with host filesystem access and remediates:
File permissions — /etc/passwd to 644, /etc/shadow to 640, /etc/group to 644, /etc/gshadow to 640. For Kubernetes nodes, also enforces 600 permissions and root:root ownership on kube-apiserver.yaml, kube-controller-manager.yaml, kube-scheduler.yaml, etcd.yaml.
Kernel parameters — sysctl hardening, persisted to /etc/sysctl.conf:
       net.ipv4.conf.all.send_redirects=0
net.ipv4.conf.default.send_redirects=0
net.ipv4.conf.all.accept_source_route=0
net.ipv4.conf.default.accept_source_route=0
net.ipv4.conf.all.accept_redirects=0
net.ipv4.conf.default.accept_redirects=0
net.ipv4.tcp_syncookies=1
net.ipv6.conf.all.accept_ra=0
net.ipv6.conf.default.accept_ra=0
SSH hardening — PermitRootLogin no, PermitEmptyPasswords no, MaxAuthTries 4, ClientAliveInterval 300, ClientAliveCountMax 3, LoginGraceTime 60.
Kernel modules — disables cramfs, squashfs, udf via /etc/modprobe.d/cis-hardening.conf.
Auditd rules — watch rules on /etc/passwd, /etc/shadow, /etc/group, /etc/gshadow.
Dry-run mode is essential. On first deployment, it logs every change it would make without touching anything:
       [DRY-RUN] Would execute: chmod 640 /host/etc/shadow
[DRY-RUN] Would execute: sysctl -w net.ipv4.conf.all.send_redirects=0
[DRY-RUN] Would execute: echo 'PermitRootLogin no' >> /host/etc/ssh/sshd_config
When you’re ready to go live, flip autoRemediation.dryRun: false. It sends a Slack notification with a count of changes made per node.
Observability: Prometheus + Grafana
Wazuh has its own dashboard for browsing alerts and SCA results, and a REST API for programmatic access. What it doesn’t ship is a Prometheus exporter — so this chart adds a small metrics sidecar to each agent pod that scrapes the local agent’s status and queries the Wazuh manager API for per-node SCA / vulnerability / alert counts.
Six metrics exposed:
| Metric | Type | Description |
|---|---|---|
wazuh_agent_up | gauge | Is the agent process running (0/1) |
wazuh_sca_checks_passed | gauge | Number of SCA checks currently passing |
wazuh_sca_checks_failed | gauge | Number of SCA checks currently failing |
wazuh_fim_events_total | counter | Total file integrity change events |
wazuh_vulnerabilities_detected | gauge | Current vulnerability count |
wazuh_alerts_total | counter | Total alerts generated |
The chart ships a PrometheusRule with six alerts:
- WazuhAgentDown — agent offline for 5+ minutes (critical)
- WazuhHighSCAFailureRate — >30% of checks failing (warning)
- WazuhCriticalSCAFailures — >50% of checks failing (critical)
- WazuhVulnerabilitiesDetected — >50 vulnerabilities on a node (warning)
- WazuhFIMSpikeDetected — unusual rate of file changes (warning)
- WazuhAlertStorm — >50 alerts/sec indicating an active incident (critical)
The Grafana dashboard is auto-discovered via sidecar label and shows: agent status, compliance score gauge, SCA pass/fail per node, vulnerability trends, FIM event rate, alert rate with threshold highlighting.
For an at-a-glance correlation across alert sources, the Threat Hunting view aggregates everything the chart produces — SCA findings, ossec rules, rootcheck — and breaks them down by PCI-DSS requirement, rule group, and severity. The screenshot below is from the same lab agent the API snippets above were captured against (511 alerts in the last 24 h, top-5 rule group dominated by sca):
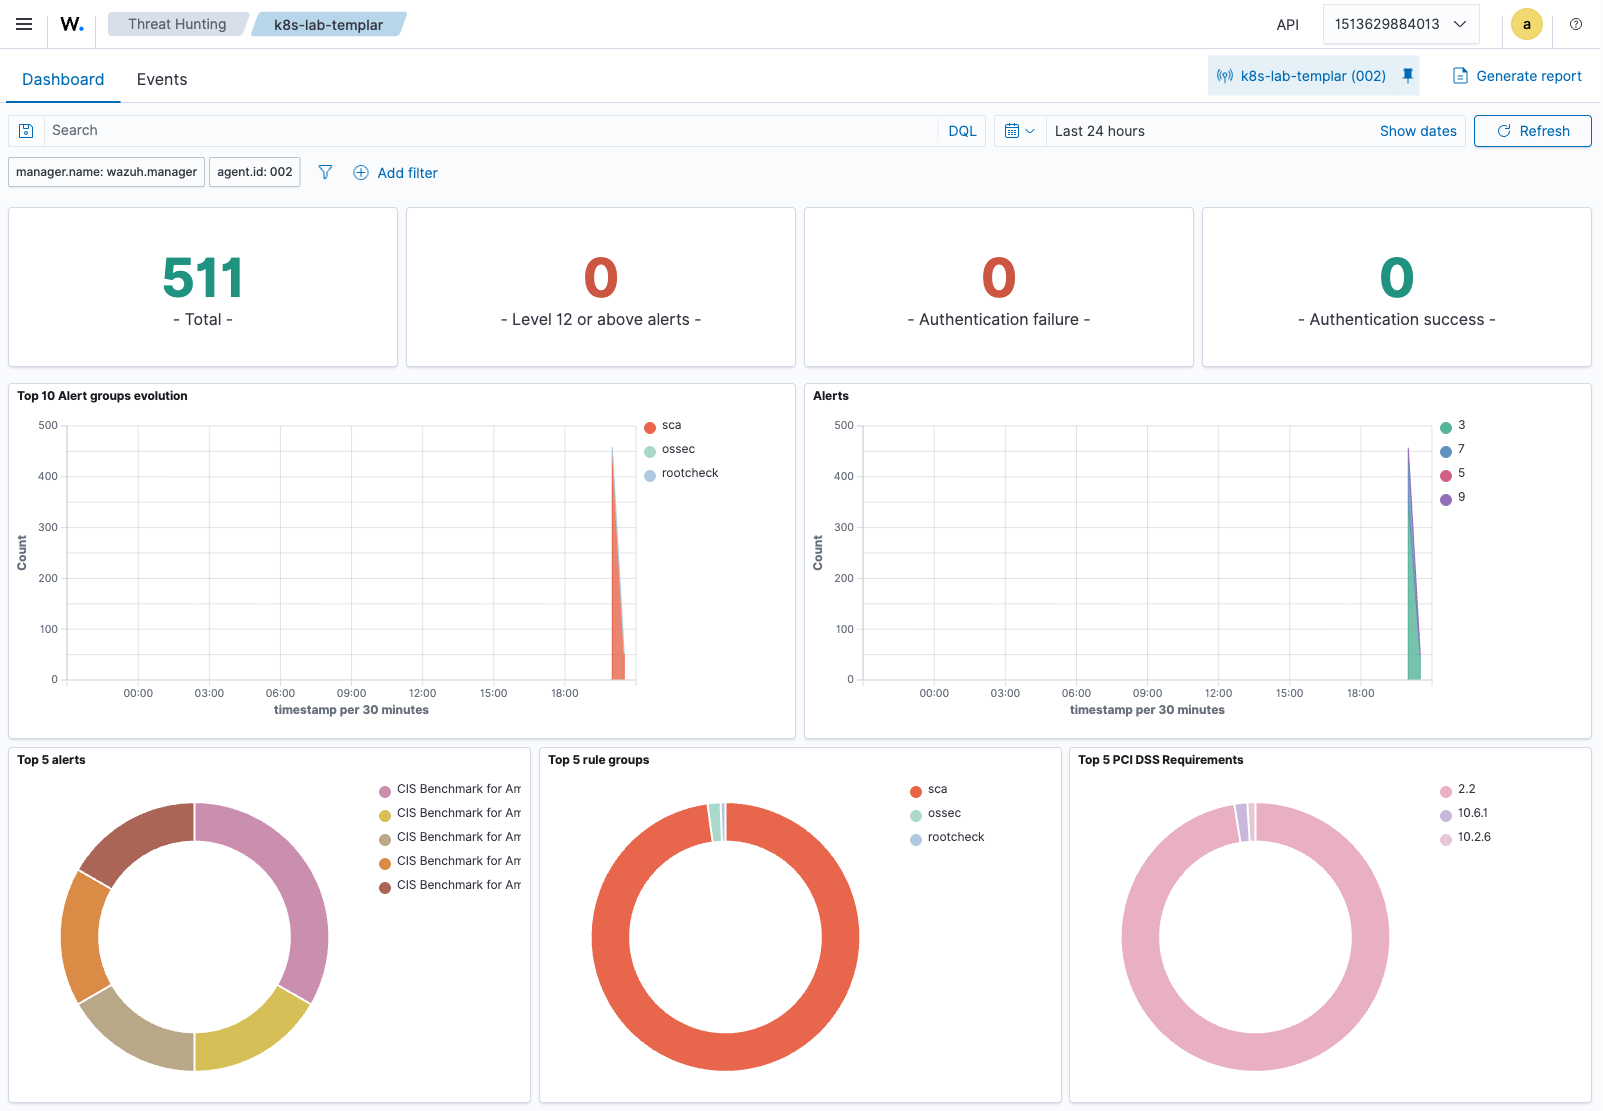
A Grafana dashboard sourced from this chart’s Prometheus exporter would render the same data in tile form — the screenshot above is the native Wazuh view; the chart’s Grafana panels (not pictured here) are a Prometheus-fed re-render of the same metrics.
Self-hardening: the chart secures itself
A security chart that isn’t itself hardened is a joke. The K8s-native hardening below is chart-added — Wazuh ships an agent, not Kubernetes deployment manifests:
- NetworkPolicy — Agent pods can only reach the Wazuh manager, DNS, and the Kubernetes API. Webhook pods only accept traffic from the API server.
- PodDisruptionBudget — Maintains 50% agent availability during rolling updates and node drains.
- Seccomp — RuntimeDefault profile on all pods.
- Secret management — Registration passwords stored in Kubernetes Secrets with
helm.sh/resource-policy: keep. Supports external secret references. - Config checksums — DaemonSet pods auto-restart when ConfigMaps change. No manual rollout needed.
- cert-manager integration — Webhook TLS and optional agent↔manager mTLS via cert-manager Certificates with ECDSA P-256 keys.
- Manager HA — supports multiple manager endpoints with automatic failover (the failover list is configured here; the failover mechanism itself is in the Wazuh agent).
- Values schema validation — JSON Schema catches misconfiguration before
helm installruns. - Priority class — Agents run as
system-node-criticalso they’re the last thing evicted under resource pressure.
Deploying it
Minimal deployment with CIS + NIST enabled by default:
helm install wazuh-hardening ./wazuh-k8s-hardening \
--namespace wazuh-system --create-namespace \
--set manager.host=wazuh-manager.wazuh.svc.cluster.local \
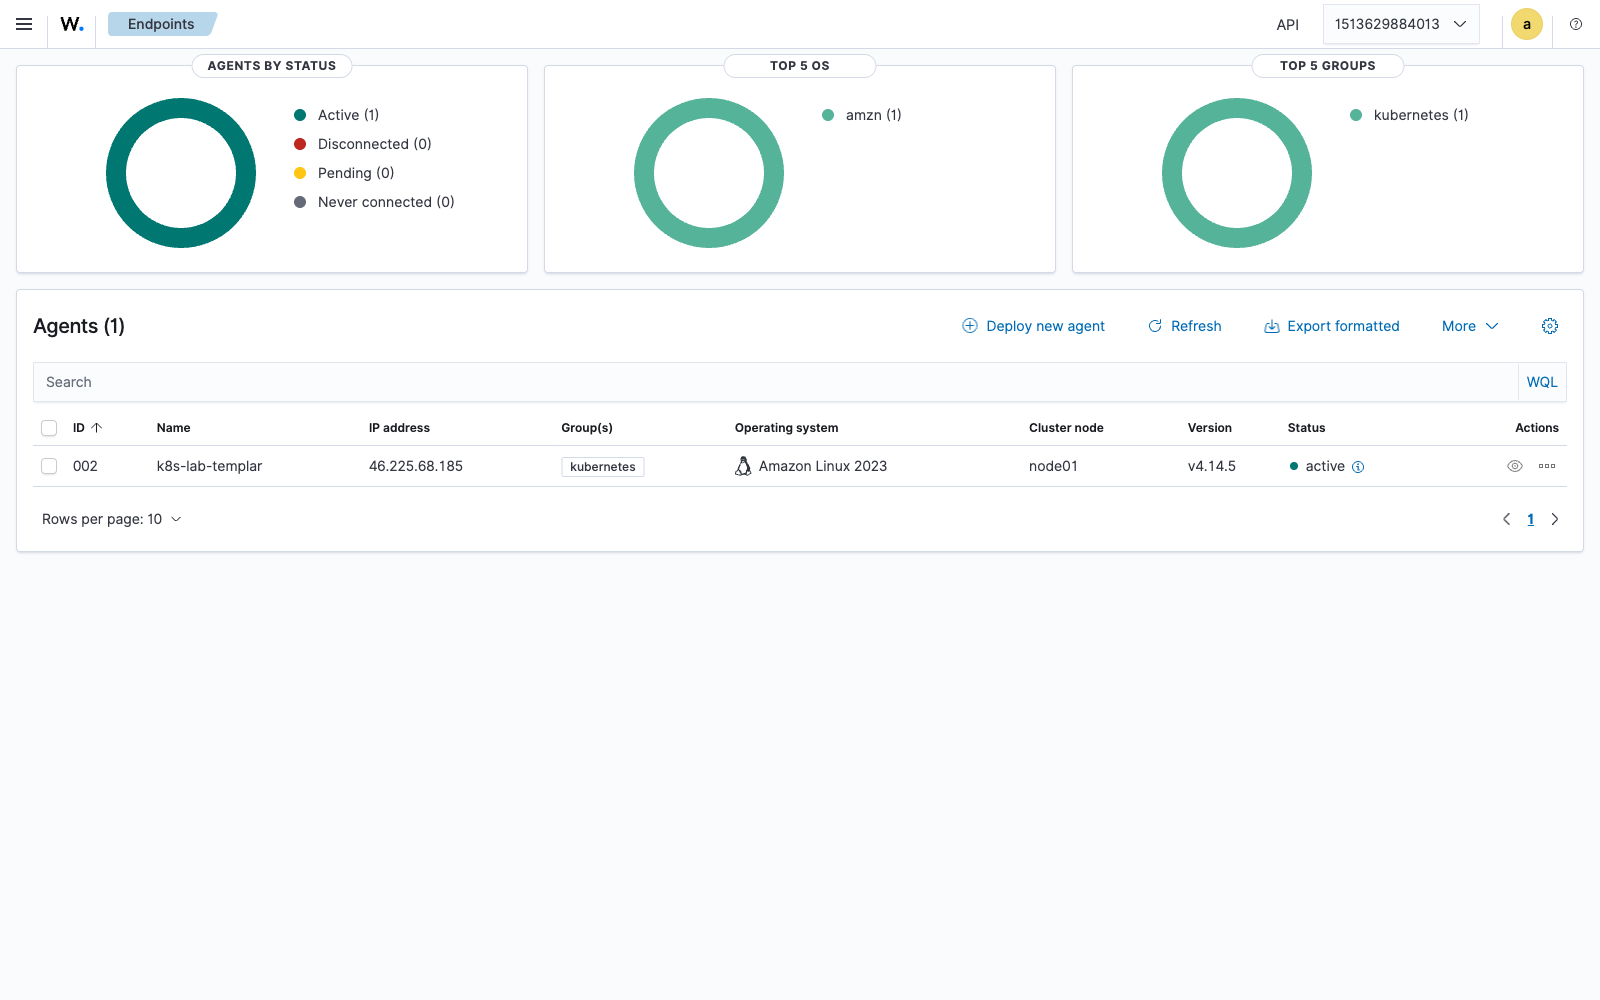
--set manager.registrationPassword=YOUR_PASSWORDOnce it’s up, the agent self-enrolls with the manager and appears in the Endpoints view — for the single-node lab this looks like:
Full enterprise deployment:
       global:
  clusterName: "prod-us-east-1"
  environment: "production"
  organization: "Your Org"

manager:
  host: "wazuh-manager.wazuh.svc.cluster.local"
  existingSecret: "wazuh-auth"
  failover:
    enabled: true
    hosts:
      - host: "wazuh-manager-2.wazuh.svc.cluster.local"

compliance:
  cisKubernetes:
    profile: "L2"
  cisLinux:
    profile: "L2"
  nist80053:
    enabled: true
  pciDss:
    enabled: true
  hipaa:
    enabled: true
  soc2:
    enabled: true

admissionWebhook:
  enabled: true
  failurePolicy: "Fail"

autoRemediation:
  enabled: true
  dryRun: false
  notifications:
    enabled: true
    slackWebhookUrl: "https://hooks.slack.com/services/..."
Why Wazuh
I chose Wazuh as the engine because it’s the only open-source platform that runs SCA, FIM, vulnerability detection, log collection, rootcheck, and active response from a single agent binary, with a manager that aggregates findings across every node into one queryable surface. Falco does runtime detection well but doesn’t do compliance scanning. kube-bench does CIS but nothing else. OPA does admission but doesn’t touch host-level hardening.
Wazuh’s SCA engine accepts custom YAML policy files with the compliance: field built in — which is the native capability that makes multi-framework cross-reference possible without writing a custom mapping engine. The MITRE ATT&CK fields on rules and alerts are also native — this chart just feeds the SCA engine policy content that uses them.
This chart extends Wazuh’s reach into the areas it doesn’t ship by default: admission-time enforcement, automated infrastructure remediation, Prometheus-native observability, scheduled multi-framework reporting, and K8s-native self-hardening. It’s a packaging story around Wazuh, not a replacement for Wazuh — the detection, scanning, and alerting engines are all Wazuh-native, and the chart’s value is bundling production-grade policy content, K8s integration, and tooling that complements them.
Part of the Wazuh Ambassadors Program
I built and published this as a member of the Wazuh Ambassadors Program — the community initiative that supports people building and sharing open-source security work on top of Wazuh. If this write-up or the chart was useful and you want to explore Wazuh yourself, you can reference my ambassador code AM-5597-622.
Resources
- Wazuh Documentation — SCA
- Wazuh Documentation — Active Response
- Wazuh Documentation — MITRE ATT&CK integration
- CIS Kubernetes Benchmark v1.8.0
- NIST 800-53 Rev5 Control Catalog
- PCI-DSS v4.0 Standards
- HIPAA Security Rule — Technical Safeguards
- SOC2 Trust Services Criteria
- MITRE ATT&CK Containers Matrix
- Wazuh K8s Hardening — GitHub Repository