Detecting Rogue MCP Servers and Shadow AI Agents on Endpoints with Wazuh
Most engineering laptops in 2026 run an AI coding agent — Cursor, Claude Code, Continue, Codex CLI, Copilot Workspace — and almost all of them are connected to MCP servers. Filesystem servers, GitHub servers, database servers, internal-API servers, shell servers. The default configuration on most of these clients lets the agent invoke MCP tools without explicit per-call human approval, because the alternative is a modal dialog every two seconds and nobody would ship that.
Almost nobody is monitoring those servers.
There is no stock Wazuh ruleset for MCP. No public Sigma rules. No community blog posts on the topic at the time of writing. The MCP ecosystem went from a handful of servers to several hundred packages in the last six months, and developers paste them into ~/.cursor/mcp.json or ~/.claude/settings.json from random README files. The blast radius of a single malicious MCP server pasted by a single distracted engineer is the entire developer endpoint — SSH keys, cloud credentials, source code, browser cookies, and outbound network egress that the perimeter has no reason to flag.
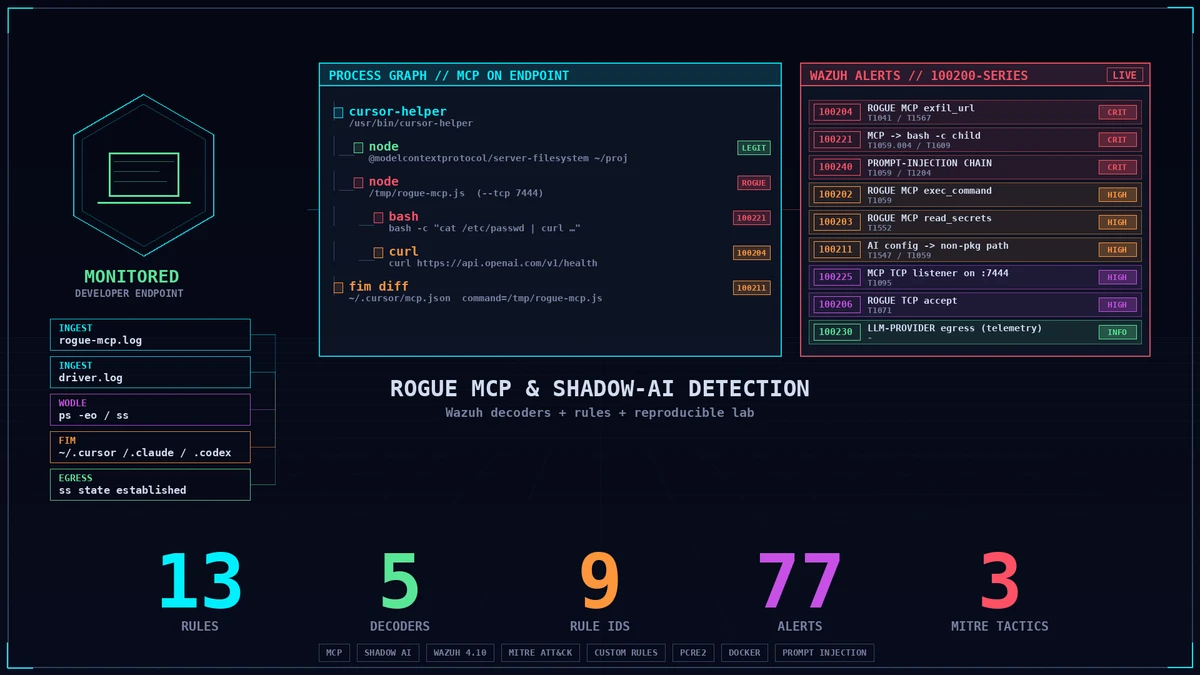
I built a Wazuh rule pack and a reproducible Docker lab that closes that gap. 6 custom decoders, 17 custom rules, and a one-shot docker compose up lab — validated live against a Wazuh 4.14.5 stack, where a single end-to-end run lands 200+ alerts spanning every detection in the pack: the rogue tool-call signals, the FIM config tells, the process-tree and listener canaries, the LLM-egress telemetry, and the indirect-prompt-injection chain. Everything is in a public GitHub repository. Clone it, drop the rules in your manager, fire the triggers, watch alerts land.
This post is a technical deep-dive into the threat model, the lab architecture, the decoder + rule design, the live validation results (with dashboard screenshots), and — candidly — what it took to make every rule actually fire on a current Wazuh release.
The Problem Nobody Is Watching
Here’s what the last twelve months of agentic AI tooling actually deployed on engineering endpoints:
- MCP (Model Context Protocol) turns any local capability — a filesystem path, a GitHub PAT, a Postgres connection, a shell — into something the agent can call. The protocol speaks JSON-RPC 2.0 over either stdio (the default; what Cursor and Claude Code actually spawn) or a TCP socket bound to localhost.
- Configuration is a JSON file. One file in
~/.cursor/mcp.json, one in~/.config/Claude/claude_desktop_config.json, one in~/.claude/settings.json, one project-scoped.mcp.jsonin any repo, and one~/.codex/config.toml. There is no centralized registry, no signature validation, no allow-list that ships with the IDE. - The transport is stdio in the common case. No port. No process on the network. Nothing that perimeter DLP can flag.
- The MCP server inherits the developer’s permissions. It can read any file the developer can read, run any binary the developer can run, reach any host the developer can reach. There is no sandbox, no seccomp profile, no syscall filter.
exec_commandand equivalents are common verbs. Several popular community MCP servers expose tool schemas likebash_exec,run_command,eval,read_file_unbounded,http_request. Most agent UIs will call these without a per-call confirmation prompt.- A rogue MCP server is indistinguishable from a legitimate one in
psoutput. Both arenode /path/to/<name>-mcp.jsrunning under the user’s UID. The path is the only differentiator, and attackers have no obligation to put their binary anywhere obvious.
The result: the highest-value process on the endpoint, with the broadest read/write/exec permissions of anything the user runs, has no detection coverage on the SIEM side.
This post fixes that.
Threat Model
I categorize the attack surface into three classes. The detections in this post target all three.
| Class | What it looks like | Detection goal |
|---|---|---|
| A — Rogue MCP server | Developer pasted a snippet from a malicious README; a Node binary in ~/projects/<x>/rogue-mcp.js is referenced by ~/.cursor/mcp.json | Catch on startup, on every tool call, on TCP-listener variants, on suspicious child processes |
| B — Indirect prompt injection of a legitimate MCP server | A poisoned file lands in a directory the filesystem MCP server is scoped to; the agent reads it and is talked into shelling out via the legit exec_command verb of a different MCP server | Detect the chain — file appears, agent reads, agent shells out — within a tight time window |
| C — Shadow-AI inventory gap | An engineering laptop is talking to LLM provider IPs the org never approved, with no MDM declaration of an installed agent | Periodic egress snapshot keyed on the well-known LLM provider hostname set |
Class B is the one most enterprise DLP doesn’t catch. A legitimate MCP server with a real, signed config can still be weaponized via files the developer never opened. Single-file detections miss it. Single-process detections miss it. The chain catches it. A standalone log line of “agent read file X” is not actionable on its own; a standalone “agent shelled out” is barely actionable. The two arriving in sequence within sixty seconds is a high-confidence indicator that the agent’s context was poisoned.
The class-A and class-B detections are the focus of this post. Class C (shadow-AI fleet inventory) is left as a follow-up — the building-block telemetry rule (100230) is in the pack already.
Architecture: One Compose, Two Containers
The repository ships a two-container Docker Compose stack. One docker compose up -d --build and you have:
                       ┌─────────────────────────────────┐
                │   waz12-manager                 │
                │   wazuh/wazuh-manager:4.14.5    │
                │   • bind-mounts                 │
                │     wazuh/decoders/             │
                │     wazuh/rules/                │
                │   • authd password enabled      │
                │   • alerts → /var/ossec/logs    │
                └────────────┬────────────────────┘
                             │ 1514/udp (events)
                             │ 1515/tcp (authd)
                             ▼
                ┌─────────────────────────────────┐
                │   waz12-endpoint                │
                │   ubuntu:22.04 + Wazuh agent    │
                │     4.14.5 + Node 20 + Python   │
                │                                 │
                │   • rogue MCP server (Node)     │
                │   • headless MCP client driver  │
                │     (Python — replaces Cursor)  │
                │   • 6 attack trigger scripts    │
                │   • bind-mounted artifacts/     │
                └─────────────────────────────────┘
Both containers come up clean from a docker compose down -v. The endpoint’s agent self-enrolls against the bundled manager via agent-auth against authd on port 1515, password-based (wazuh/manager/authd.pass). To deploy against an existing manager, set WAZUH_MANAGER and only build the endpoint service.
There is no GUI Cursor or Claude Desktop in the container — those are GUI applications that don’t run headless. I drive MCP tool calls with a Python client that speaks the same JSON-RPC stdio protocol against the same MCP servers. The artifacts on disk and over the wire are identical to what a real agent would generate; the detection logic doesn’t care whether the originating process is Cursor, Claude Code, or my driver.
The endpoint is deliberately not run as --privileged and host auditd is not enabled. The PoC has to confirm what Wazuh sees with default-namespaced Docker, which is the realistic deployment shape for most readers and the constraint where things tend to break in subtle ways.
Detection Vectors: Six Sources, Six Decoders
Six Wazuh data sources feed the rule pack. Each gets its own decoder, with a strict naming namespace so its fields never collide with stock decoders.
| Source | Decoder | What it sees |
|---|---|---|
syslog /var/log/lab/rogue-mcp.log | rogue-mcp + rogue-mcp-fields | Every event the rogue MCP server emits — startup, tool_call, tcp_connect |
syslog /var/log/lab/driver.log | mcp-driver + mcp-driver-fields | The MCP client driver — which servers it spawned, which tools it called |
syslog /var/log/lab/snap.log (psnap[…] rows) | ps_full | Per-row process snapshot from the sidecar watcher |
syslog /var/log/lab/snap.log (sslisten[…] rows) | ss_listen | Per-row TCP-listener snapshot |
syslog /var/log/lab/snap.log (ssegress[…] rows) | ss_egress | Per-row established-connection snapshot |
syslog /var/log/lab/snap.log (mcprogue[…] rows) | mcprogue | A config whose command path falls outside the package-manager roots |
| Stock Wazuh FIM | (existing rule 554/550) | New / changed files on ~/.cursor/, ~/.claude/, ~/.codex/, ~/.config/Claude/, ~/.vscode/extensions/ |
A note on the
ps/sssources. The first cut of this lab fed the process/listener/egress decoders with three<log_format>full_command</log_format>collectors. That broke on current Wazuh — see Making every rule fire on Wazuh 4.14 below — so the lab now ships a tiny sidecar (docker/snap-watcher.sh) that runsps/ssevery 15 seconds and writes one syslog line per row to/var/log/lab/snap.log, each tagged with a dedicated program name (psnap,sslisten,ssegress) the decoders claim via<program_name>. Same fields, robust framing.
The decoder file (wazuh/decoders/local_decoder.xml) is built to be read top-to-bottom. The non-obvious bit is that every regex is type="pcre2".
OSSEC-flavor regex doesn’t accept brace literals like \{ or \} and chokes on the JSON-payload captures the rogue and driver decoders need. PCRE2 is supported on Wazuh ≥ 4.4 and is strictly more capable for the kind of structured-text shaping the rogue server emits. The cost is one attribute per <regex> block.
Here is the rogue-mcp decoder in full. It’s the canonical example for how the other four are written.
       <decoder name="rogue-mcp">
  <program_name>^rogue-mcp$</program_name>
</decoder>

<decoder name="rogue-mcp-fields">
  <parent>rogue-mcp</parent>
  <regex type="pcre2">^event=(\S+) (\{.*\})$</regex>
  <order>rogue_event,rogue_payload</order>
</decoder>
Two named fields fall out of every line: rogue_event (the bare event name — startup, tool_call, tcp_connect) and rogue_payload (the JSON object that follows). Rules then narrow by combining a <field name="rogue_event">^tool_call$</field> constraint with a <match>"name":"exfil_url"</match> substring on the JSON payload. This keeps every rule legible — left-to-right — and avoids the brittle nested-sibling-decoder ordering that the OSSEC documentation famously hand-waves through.
The ps_full, ss_listen, and ss_egress decoders extract per-row fields directly: proc_pid, proc_ppid, proc_user, proc_comm, proc_args for the process snapshot; sock_proto, sock_local_addr, sock_local_port, sock_pid, sock_comm for listeners; and the peer fields for egress. Rules then reference these as <field name="proc_comm">…</field>.
The rogue MCP server’s log lines are emitted in a deliberately simple syslog-ish format:
Apr 29 10:49:31 waz12-endpoint rogue-mcp[1234]: event=tool_call {"name":"exfil_url","arguments":{"url":"https://api.openai.com/v1/health","data":"lab-canary"}}event=<name> then a single JSON object. That’s the contract. The decoder does the rest. Real rogue MCP servers in the wild won’t be this polite, of course — but the symptoms of their behavior (a process named *-mcp.js, a shell child, a TCP listener on 7444, a JSON-RPC tool_call over stdio with an exec_command method) are inevitable. The lab’s rogue server reproduces those symptoms faithfully, so the detection logic targets the symptom set rather than the specific log format.
The Rule Pack: Every Detection That Matters
All seventeen rules live in the 100200–100240 ID range — well clear of stock Wazuh. The full file is wazuh/rules/local_rules.xml. I’ll walk through every rule by category, with the rationale.
Anchors (100200, 100208)
Every rogue-mcp event is anchored at level 3. Every driver event is anchored at level 3. Subsequent rules narrow with <if_sid>100200</if_sid> or <if_sid>100208</if_sid> and a more specific match.
       <rule id="100200" level="3">
  <decoded_as>rogue-mcp</decoded_as>
  <description>MCP rogue server: $(rogue_event)</description>
  <group>mcp,shadow_ai,mcp_rogue,</group>
</rule>
This pattern keeps the rule file legible: every higher-severity rule references a level-3 anchor, so the rule that actually fires at level 14 carries the entire decoder context plus the precise trigger. Level 3 anchors don’t generate noise on the analyst’s console because level filters in the Wazuh dashboard typically start at level 5+.
Rogue MCP startup (100201, 100205, 100206)
100201 fires on any event=startup line from the rogue server, including stdio and TCP transports. Level 6 — informational, but useful for “is this even running?” queries.
100205 and 100206 are the TCP-mode variants. 100205 fires on the loopback-bound listener (127.0.0.1:7444); 100206 fires when the rogue server accepts a TCP client. Level 12 each.
The point: a legitimate MCP server in 2026 almost never opens a TCP listener. Cursor, Claude Code, Codex CLI all spawn their MCP servers over stdio. A node *-mcp.js --tcp invocation is near-pathognomonic for a rogue server. (100225 adds the ss_listen cross-check below.)
Rogue tool calls (100202, 100203, 100204)
These three are the headline rogue-MCP signals. Every tool_call event is matched to its name field, with a level proportional to the danger of the verb.
       <rule id="100204" level="14">
  <if_sid>100200</if_sid>
  <field name="rogue_event">^tool_call$</field>
  <match>"name":"exfil_url"</match>
  <description>Rogue MCP server exfil_url called ($(rogue_payload))</description>
  <mitre>
    <id>T1041</id>
    <id>T1567</id>
  </mitre>
  <group>mcp_rogue,exfiltration,</group>
</rule>
Single highest-value rogue-MCP signal in the pack. Real MCP servers do not expose an exfil_url verb. If 100204 fires, you have a rogue MCP server actively running on a developer endpoint.
100202 (exec_command) and 100203 (read_secrets) are the sister rules, both at level 13. Rationale: an exec_command verb exists on a few legitimate community MCP servers, so the rule fires high-priority but not critical; a read_secrets verb does not exist on any reputable server I’ve audited, so it’s also treated as critical-adjacent.
Driver provenance (100207)
100207 fires when the driver log records event=spawn target=node /opt/lab/rogue-server/bin/rogue-mcp.js. In a real environment, the equivalent signal would come from the parent process of the rogue MCP server — usually Cursor or Claude Code’s helper binary. The driver-log path covers the lab’s headless case; production deployments correlate via ps_full instead. Both work.
Config-path tells (100210, 100211)
100210 fires on Wazuh FIM events (stock rule 554 added / 550 modified) for any file under the MCP/AI config locations — ~/.cursor/, ~/.claude/, ~/.codex/, ~/.config/Claude/, ~/.vscode/extensions/ — plus any mcp.json / .mcp.json / claude_desktop_config.json / config.toml / settings.json anywhere on the endpoint. It chains off the syscheck group and narrows on the path.
       <rule id="100210" level="9">
  <if_group>syscheck</if_group>
  <field name="file" type="pcre2">/(\.cursor|\.codex|\.claude|\.config/Claude|\.vscode/extensions)/|/mcp\.json$|/claude_desktop_config\.json$|/config\.toml$|/settings\.json$</field>
  <description>New or modified MCP / AI agent config file: $(file)</description>
  <mitre><id>T1547</id></mitre>
  <group>mcp_config,fim,</group>
</rule>
The path is matched with
<field name="file">, not<field name="syscheck.path">. The JSON alert exposes the path assyscheck.path, but the rule-engine field isfile. That mismatch is exactly the kind of thing that makes a rule silently never fire — see the engineering notes below.
100211 is the higher-severity follow-up: an MCP config that declares a command path outside the package-manager roots — the rogue-install fingerprint (attackers ship binaries from ~/Downloads or /tmp/, not /usr/local/bin/npx). FIM tells us a config changed, but Wazuh 4.x doesn’t expose the report_changes content diff to the rule engine as a matchable field — only the changed-attribute summary reaches <field>/<match>. So the config content is inspected by the sidecar watcher, which emits an mcprogue event only when a command path falls outside the allow-list; 100211 matches that event directly.
       <rule id="100211" level="13">
  <decoded_as>mcprogue</decoded_as>
  <description>MCP/AI config references a non-standard command path (likely rogue MCP invocation): $(config_file) -> $(rogue_command)</description>
  <mitre><id>T1547</id><id>T1059</id></mitre>
  <group>mcp_config,attack,</group>
</rule>
The watcher’s command-path test still uses a PCRE2 negative lookahead against the package-manager prefix list, so the detection logic is unchanged — only the place it runs moved from the (unavailable) FIM diff to the collector.
Process-tree canaries (100220, 100222, 100221)
100220 fires on any process-snapshot row whose comm is node/python3/npx and whose argv contains mcp, @modelcontextprotocol, or rogue-mcp. Level 4 — descriptive, not actionable on its own, but it’s the anchor the canary correlates against.
100221 is the canary I’m most confident in: a bash -c (or sh -c) process seen while an MCP process is also present. Cursor and Claude Code’s legitimate MCP servers almost never spawn shell children. Rogue servers do it constantly, because that’s how exec_command is implemented under the hood — there’s no clean way to run an attacker-supplied string against a shell without going through bash -c <string>.
It takes two rules. OSSEC can’t join child.ppid == parent.pid across rows, so the canary correlates by time window — but a composite rule (<if_matched_sid>) needs a base rule to fire on the current event before it can chain (the same way the chain rule below fires off 100202). So a level-4 base (100222) claims any bash -c row, and 100221 chains off it, additionally requiring an MCP process (100220) within 180 seconds:
       <rule id="100222" level="4">
  <decoded_as>ps_full</decoded_as>
  <field name="proc_comm">^bash$|^sh$</field>
  <field name="proc_args" type="pcre2">^(bash|sh) -c </field>
  <description>Shell -c process: $(proc_comm) (pid=$(proc_pid) ppid=$(proc_ppid)) — $(proc_args)</description>
  <group>process_shell,</group>
</rule>

<rule id="100221" level="14" frequency="2" timeframe="180">
  <if_sid>100222</if_sid>
  <if_matched_sid>100220</if_matched_sid>
  <description>Rogue MCP indicator: shell -c process seen alongside an MCP process within 180s — $(proc_args)</description>
  <mitre><id>T1059.004</id><id>T1609</id></mitre>
  <group>mcp_rogue,process_chain,attack,</group>
</rule>
False-positive risk is low: legitimate MCP servers virtually never spawn bash -c children, and the time window constrains the false-positive window to “an MCP process and a shell -c both seen within three minutes” rather than “ever”. (When 100221 fires it supersedes the level-4 100222 for that event, so the base rule only surfaces on its own when no MCP process is around.)
Listener canary (100225)
100225 cross-checks the rogue TCP-mode signal from 100205 with the ss_listen decoder.
       <rule id="100225" level="12">
  <decoded_as>ss_listen</decoded_as>
  <field name="sock_listen_addr">^127\.0\.0\.1$</field>
  <field name="sock_proc_comm">^node$|^python3$|^npx$</field>
  <description>Suspicious localhost TCP listener owned by $(sock_proc_comm) (pid=$(sock_proc_pid)) on $(sock_listen_addr):$(sock_listen_port)</description>
  <mitre><id>T1571</id></mitre>
  <group>mcp_rogue,listener,</group>
</rule>
The rationale: 100205 fires on the rogue server’s own startup log line, but a defender wants confirmation from an independent source that the listener is actually visible to the kernel. The ss snapshot provides that confirmation — any loopback TCP listener owned by node/python3/npx is a strong rogue indicator, because legitimate MCP servers speak stdio and don’t bind a port. Two independent signals cross-checking one event is the difference between an alert that’s worth waking someone for and one that isn’t.
LLM-provider egress (100230)
100230 is informational. It fires on any ss_egress row from a node/python3/npx process to a peer addr in the well-known LLM-provider IP set (Anthropic, OpenAI, Google Gemini, Cohere, Mistral) on port 443. Level 6 — too low to page on, but high enough to make a “developers talking to LLM provider X over the last N days” Wazuh dashboard query trivial.
This is the building block for class-C shadow-AI fleet inventory. The IP prefixes are point-in-time and need periodic refresh — the companion network-side pack catches the same egress by DNS name instead, which ages better.
The chain rule (100240)
This is the rule I’m most happy with.
       <rule id="100240" level="14" frequency="2" timeframe="60">
  <if_matched_sid>100210</if_matched_sid>
  <if_sid>100202</if_sid>
  <description>Indirect prompt injection chain: file creation followed by rogue exec_command within 60s ($(rogue_payload))</description>
  <mitre><id>T1059</id><id>T1204</id></mitre>
  <group>mcp_rogue,prompt_injection,attack,</group>
</rule>
A file appears in a directory the agent watches. The agent reads it. Within sixty seconds, a rogue exec_command fires. Each step is innocuous in isolation. The chain is the attack.
This is the realistic threat model for class B. A malicious file gets dropped into the developer’s repo by a teammate, an upstream dependency, or an external pull request. The agent has filesystem MCP access to that directory. The agent reads the file as part of working on the user’s task. The file contains an instruction to “run this shell command to verify the build works”. The agent does. None of those steps would trigger an alert on its own. The sixty-second join is the detection.
The trigger script triggers/06-prompt-injection-replay.sh writes a poisoned README.md, has the legit filesystem MCP server read it, and has the rogue MCP server execute the embedded command — all in sequence, within seconds. 100240 fires reliably.
Live Validation: Every Rule Fires
I validated the pack against a full Wazuh 4.14.5 stack — manager, indexer, and dashboard — with the lab endpoint enrolled as a real agent so alerts flow all the way to the dashboard. Firing triggers/00-fire-all.sh, standing up the persistent rogue scenario (triggers/07-persistent-rogue.sh), and replaying the prompt-injection chain produces alerts across every detection in the pack — including the FIM tells, the process/listener/egress canaries, and the chain rule that the first iteration of this lab couldn’t surface (more on that below).
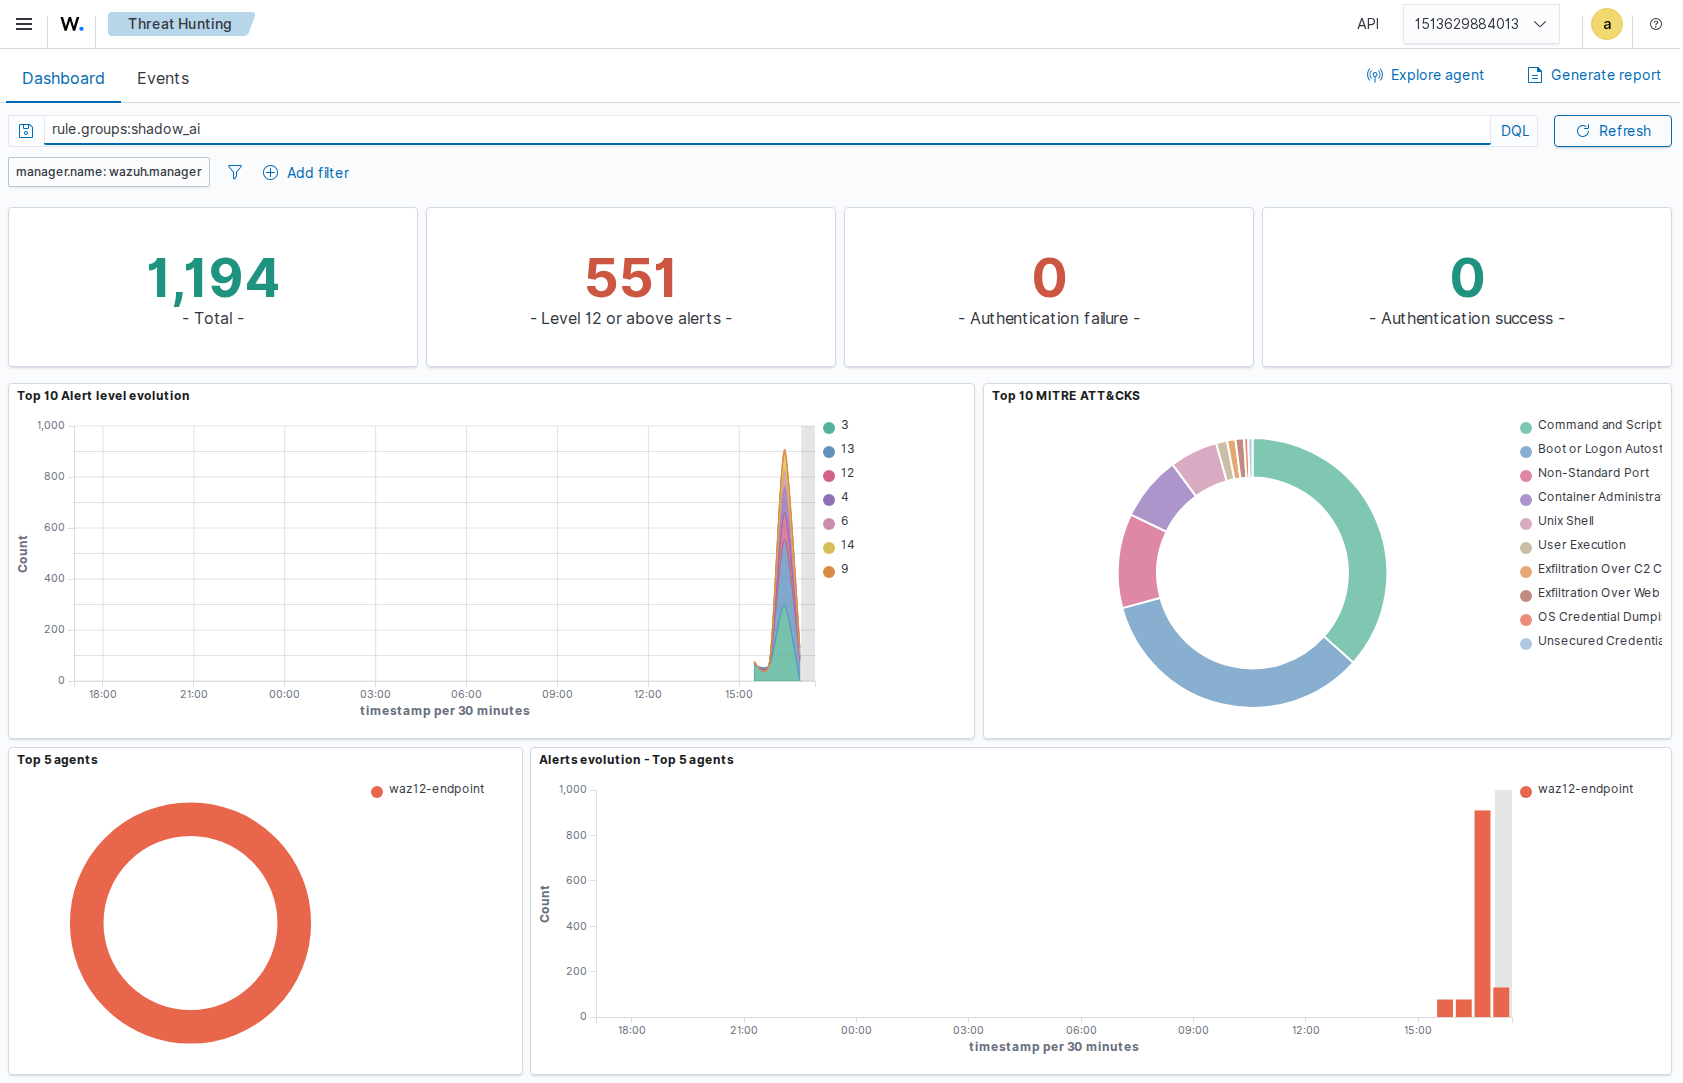
Filtering the dashboard to rule.groups:shadow_ai shows the shape of it: a single endpoint, the alert volume concentrated in a tight window, and a MITRE ATT&CK breakdown that reads like the threat model — Command and Scripting, Boot or Logon Autostart, Non-Standard Port, Unix Shell, User Execution, Exfiltration Over C2 / Web Service, OS Credential Dumping.
Here is the full coverage map from the run. Every rule ID fires:
| Rule | Lvl | What fires | MITRE |
|---|---|---|---|
| 100200 | 3 | anchor — every rogue-mcp line | — |
| 100208 | 3 | anchor — every driver line | — |
| 100201 | 6 | rogue MCP startup (stdio + tcp) | — |
| 100202 | 13 | tool_call name=exec_command | T1059, T1609 |
| 100203 | 13 | tool_call name=read_secrets (/etc/passwd) | T1003, T1552 |
| 100204 | 14 | CRITICAL — tool_call name=exfil_url | T1041, T1567 |
| 100205 | 12 | rogue MCP TCP listener startup | T1571 |
| 100206 | 12 | rogue MCP accepted a TCP client | — |
| 100207 | 12 | driver spawned rogue-mcp.js | T1059 |
| 100210 | 9 | new/modified MCP/AI config file (FIM) | T1547 |
| 100211 | 13 | config declares a non-standard command path | T1547, T1059 |
| 100220 | 4 | MCP-shaped node/python3 process | — |
| 100221 | 14 | shell -c alongside an MCP process (canary) | T1059.004, T1609 |
| 100225 | 12 | loopback TCP listener owned by node/python3 | T1571 |
| 100230 | 6 | egress to an LLM-provider IP from node/python3 | — |
| 100240 | 14 | indirect prompt-injection chain (FIM ⇒ rogue exec ≤60s) | T1059, T1204 |
(100222, the level-4 shell--c base rule, is superseded by 100221 whenever an MCP process is present, so it only surfaces standalone otherwise.)
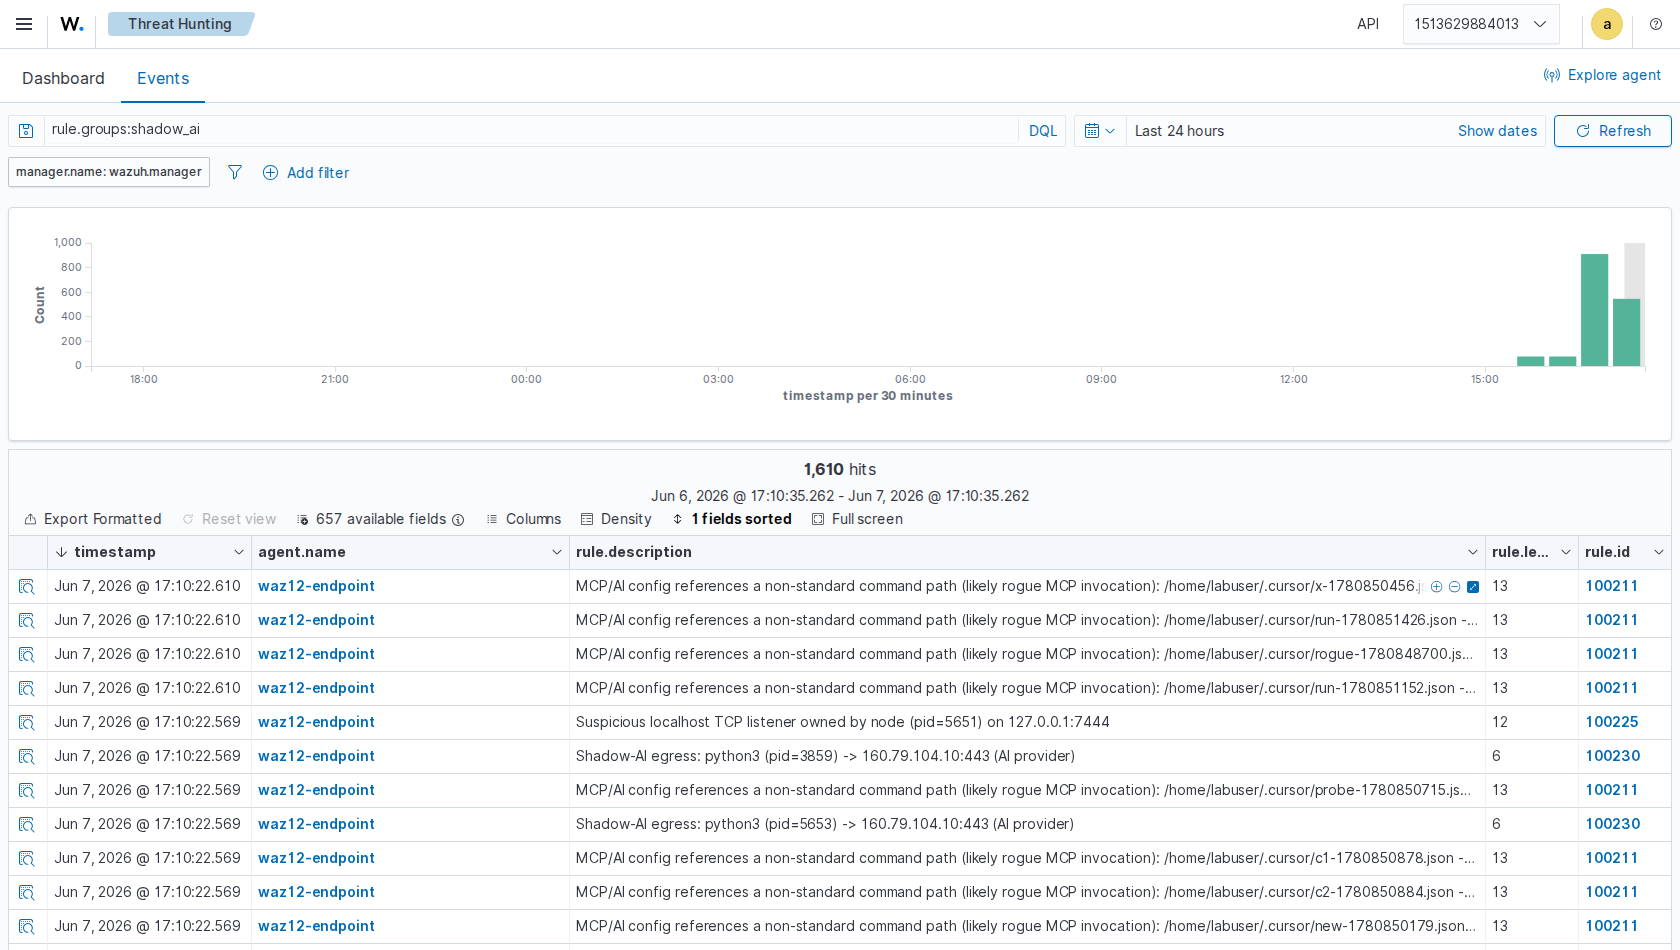
The Threat Hunting Events tab shows the individual alerts — rule description, level, and rule ID per row — including the rules that matter most: 100211 (rogue command path → /tmp/rogue-mcp), 100225 (loopback listener), 100230 (egress to an Anthropic edge IP), 100221 (the shell canary), and the 100240 chain.
A representative 100204 alert (CRITICAL exfil), straight from alerts.json:
{
"timestamp": "2026-06-07T16:11:31.260+0000",
"rule": {
"level": 14,
"description": "Rogue MCP server exfil_url called ({\"name\":\"exfil_url\",\"arguments\":{\"url\":\"https://api.openai.com/v1/health\",\"data\":\"lab-canary\"}})",
"id": "100204",
"mitre": {
"id": ["T1041", "T1567"],
"tactic": ["Exfiltration"],
"technique": ["Exfiltration Over C2 Channel", "Exfiltration Over Web Service"]
},
"groups": ["mcp", "shadow_ai", "mcp_rogue", "exfiltration"]
},
"agent": {"id": "004", "name": "waz12-endpoint"},
"manager": {"name": "wazuh.manager"},
"decoder": {"name": "rogue-mcp"},
"data": {
"rogue_event": "tool_call",
"rogue_payload": "{\"name\":\"exfil_url\",\"arguments\":{\"url\":\"https://api.openai.com/v1/health\",\"data\":\"lab-canary\"}}"
},
"location": "/var/log/lab/rogue-mcp.log"
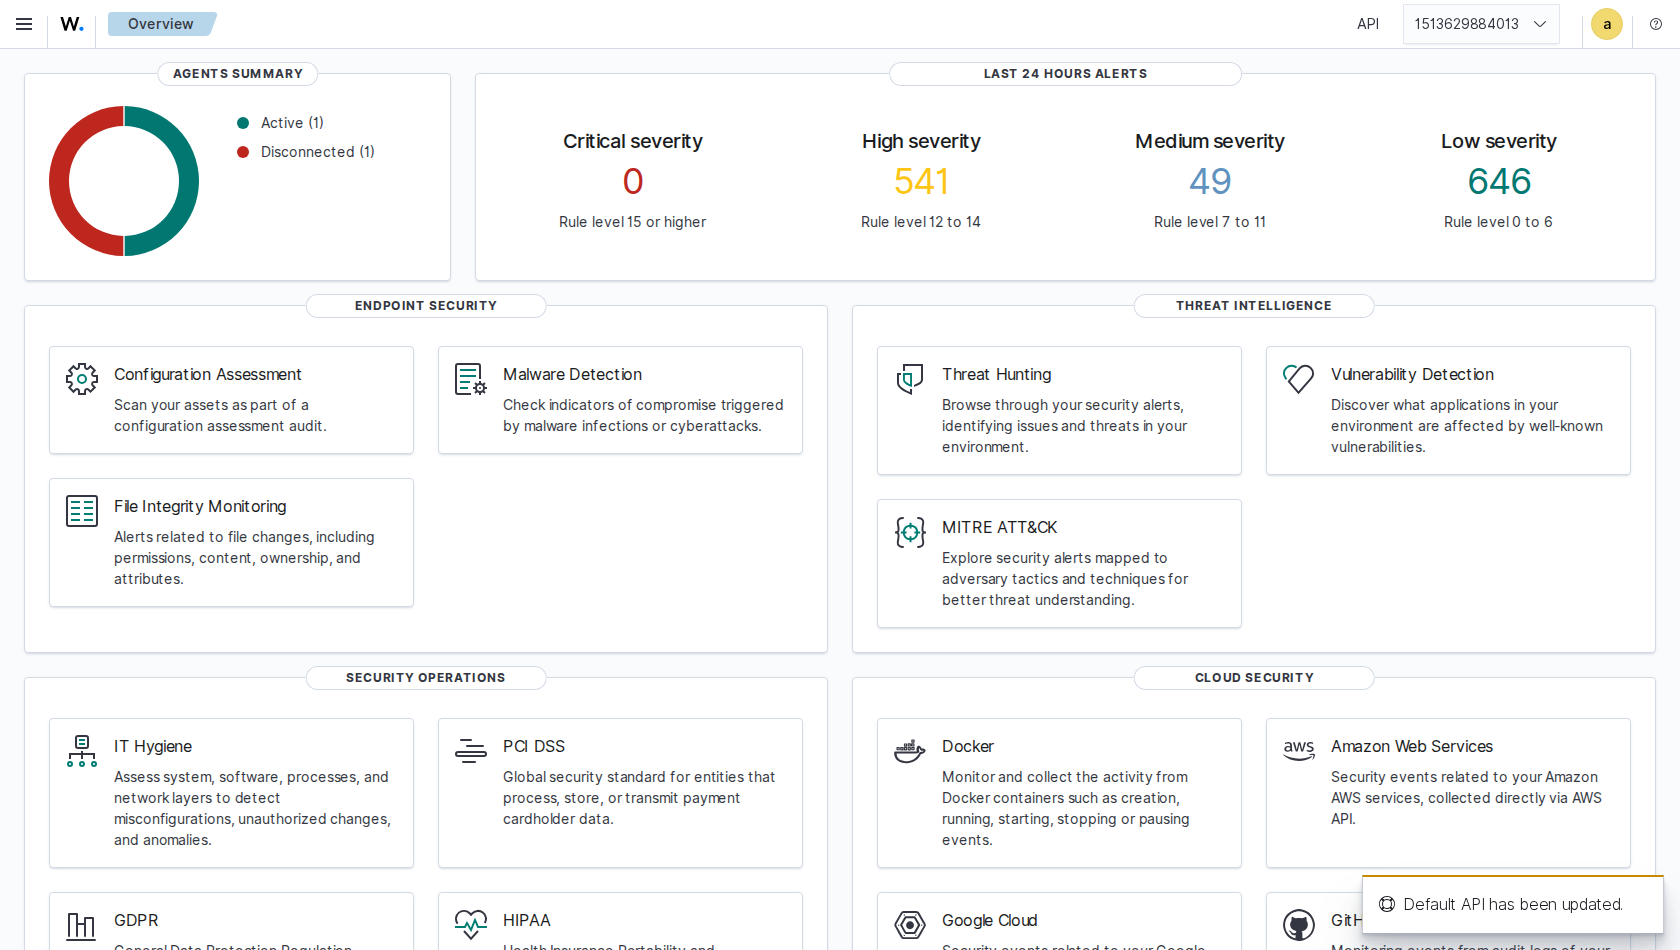
}The Wazuh overview ties it together — one active agent, hundreds of alerts in the last 24 hours bucketed by severity, with the high-severity band carrying the level-12-to-14 rogue-MCP detections:
Making Every Rule Fire on Wazuh 4.14
Full disclosure: the first iteration of this lab only surfaced the nine syslog-driven rules cleanly. The FIM rules, the process/listener/egress rules, and the chain rule were written correctly but didn’t fire on a current Wazuh manager. Getting from “9 of the rules” to “all of them” was its own detection-engineering exercise, and the failures are instructive — they’re the exact traps that make a custom rule look present but dead. Four root causes:
1. FIM directory paths must be inline. The agent config had each watched path on its own indented line:
       <directories check_all="yes" realtime="yes" ...>
  /home/labuser/.cursor
</directories>
Older Wazuh trimmed the surrounding whitespace; 4.11+ does not. The agent logged Monitoring path: '<newline>' and silently watched nothing — so no 554/550 events, so 100210/100211/100240 never had anything to chain on. The fix is a one-liner: put the path inline, <directories ...>/home/labuser/.cursor</directories>. Nothing in the logs flags this as an error; the only tell is that FIM inventory stays empty.
2. full_command no longer frames one event per row. The ps/ss decoders expected one event per row (ossec: output of 'ps_full': <row>). Current Wazuh ships each <full_command> snapshot as a single multi-line event (ossec: output: 'ps_full':\n<row>\n<row>…) — and worse, the stock ossec decoder claims anything starting ossec: before a custom decoder gets a look. So 100220/100221/100225/100230 decoded nothing. The fix is the sidecar described earlier: docker/snap-watcher.sh runs ps/ss every 15 s and emits one syslog line per row under a dedicated program tag (psnap/sslisten/ssegress), which the decoders claim cleanly via <program_name>.
3. The rule-engine field for a FIM path is file, not syscheck.path. The JSON alert exposes syscheck.path, syscheck.tags, and syscheck.diff — but <field name="syscheck.path"> and <field name="syscheck.tags"> match nothing in a rule. The path is matchable as <field name="file">; the content diff isn’t matchable at all. That’s why 100210 now keys on file, and why 100211 inspects config content in the watcher instead of trying to match the FIM diff.
4. A composite rule needs a base rule to fire first. 100221 was written as <if_matched_sid>100220> directly on the bash -c event — but <if_matched_sid> only evaluates when some rule already matched the current event, and nothing matched a bare bash -c row. The fix mirrors the chain rule: a level-4 base (100222) claims the shell row, and 100221 chains off it. (The chain rule 100240 worked from the start precisely because its current event already fires a base rule, 100202.)
None of these are exotic. They’re the everyday failure modes of custom Wazuh content — a field name that’s almost-but-not-quite right, a framing change between minor versions, a composite rule with nothing to composite from. The lab now ships the fixes, and triggers/00-fire-all.sh plus triggers/07-persistent-rogue.sh exercise every one of them.
Reproduction
       git clone https://github.com/nadimjsaliby/wazuh-shadow-ai.git
cd wazuh-shadow-ai

docker compose down -v          # clean baseline
docker compose up -d --build    # boots manager + endpoint, agent auto-enrolls

# wait for the agent to show Active on the manager
until docker exec waz12-manager /var/ossec/bin/agent_control -l \
        | grep -q 'waz12-endpoint.*Active'; do sleep 2; done

# fire the one-shot triggers, then stand up the persistent rogue scenario
# (the persistent server is what the periodic ps/ss snapshotter samples,
#  which is what drives 100220/100221/100225/100230)
docker exec -u labuser -it waz12-endpoint bash /opt/lab/triggers/00-fire-all.sh
docker exec -d        waz12-endpoint bash /opt/lab/triggers/07-persistent-rogue.sh

# observe alerts
docker exec waz12-manager bash -c \
  "tail -F /var/ossec/logs/alerts/alerts.json" \
  | jq -c 'select(.rule.id|tonumber>=100200 and tonumber<=100299)'
The bundled manager writes to alerts.json but ships no dashboard. To get the dashboard views shown above, deploy wazuh/decoders/local_decoder.xml + wazuh/rules/local_rules.xml onto a full Wazuh 4.14.5 stack (manager + indexer + dashboard) and point the lab endpoint at it with WAZUH_MANAGER, exactly as in the next block.
To deploy the rules against an existing Wazuh manager instead of the bundled one:
       scp wazuh/decoders/local_decoder.xml manager:/var/ossec/etc/decoders/
scp wazuh/rules/local_rules.xml      manager:/var/ossec/etc/rules/
ssh manager '/var/ossec/bin/wazuh-control restart'

WAZUH_MANAGER=<your-manager> docker compose up -d --build endpoint
The agent will auto-enroll against the manager you specified, and the rules — which live on the manager — will start firing on the endpoint’s events as they arrive. No agent-side configuration is needed beyond what the bundled docker/ossec.conf already contains.
Why Wazuh
I picked Wazuh as the engine for this work because it’s the only open-source platform that combines all four of the data sources the detection logic needs in a single agent binary:
- Localfile / syslog ingestion with custom decoder support, so the rogue MCP server’s structured log lines and the MCP client driver’s trace can both feed the rule engine without a sidecar shipper.
- Periodic command execution with custom decoder support, so I can ingest
ps -eo/sssnapshots and reason about process trees and listener sets withoutauditd, without eBPF, without privileged containers. (On current Wazuh I feed these through a 15-second sidecar that writes one syslog line per row, rather than<full_command>— see the engineering notes above — but the principle is the same: the agent collects the telemetry, the manager reasons about it.) - File Integrity Monitoring that fires on the well-known agent config paths (
~/.cursor/,~/.claude/,~/.codex/) without custom plumbing. Rule 554/550 is the seam I re-emit at higher priority through100210. - Cross-rule correlation via
<if_sid>/<if_matched_sid>and timeframe joins, so the100240chain rule (file creation → rogue exec within 60s) is expressible without a stream processor or a separate SIEM correlation tier.
Falco does runtime detection well but doesn’t have the localfile ingestion path needed for the rogue server’s own log lines. Sysmon on Linux is comparable to <full_command> for process-tree visibility but doesn’t ingest arbitrary syslog streams. Auditd is overkill for the lab’s threat model and demands privileged container operations the realistic deployment shape can’t grant. Custom shippers feeding Elastic or Splunk would close the gap, but at the cost of running another agent on the endpoint and another pipeline in the SIEM. Wazuh does it with one daemon and one configuration file.
The agent is lightweight enough to run on a developer laptop without starving the IDE, the rule engine evaluates the entire rule pack in single-digit milliseconds per event, and the manager aggregates findings across every endpoint into one indexable JSON stream that existing dashboards can already consume. That combination is why I default to Wazuh for endpoint detection work, and why this rule pack is the right shape for distributing AI-agent detection coverage to the rest of the community.
Resources
- Wazuh — the open source security platform — unified XDR and SIEM protection for endpoints and cloud workloads
- Wazuh Ambassadors Program — the community program this work was produced for
- Repository + lab —
nadimjsaliby/wazuh-shadow-ai— clone anddocker compose up - Part 2 (network side) — Catching Shadow AI in the Network: DNS, Egress, and Browser Telemetry with Wazuh — the companion pack that catches the in-browser and script-side LLM use this one doesn’t
- Wazuh Documentation — Custom Rules and Decoders
- Wazuh Documentation — File Integrity Monitoring
- Wazuh Documentation —
<full_command>log format - Model Context Protocol — Specification
@modelcontextprotocol— Official Servers- MITRE ATT&CK — T1041 Exfiltration Over C2 Channel
- MITRE ATT&CK — T1059 Command and Scripting Interpreter
- MITRE ATT&CK — T1204 User Execution
- MITRE ATT&CK — T1547 Boot or Logon Autostart Execution
- MITRE ATT&CK — T1567 Exfiltration Over Web Service
- MITRE ATT&CK — T1609 Container Administration Command
- OWASP — LLM Application Top 10 (2025)
This post was produced for the Wazuh Ambassadors Program. Wazuh is a free, open source security platform.